

There is no doubt that ‘big data and analytics’ has been and will continue to be hot topics for any and all businesses, college sports included. I remember 27 years ago, before analytics was even a thing, accidentally finding my love of analytical research and discovery. It was my first job out of college and I had recently been promoted to manage the district in Oregon of consumer finance for a major bank. Part of the promotion entailed greater security clearance, such that I could access any consumer file and pull the data profile of every customer. I wanted an edge, an advantage, an efficiency no one else had discovered and I felt it would be found in the consumer behavior metrics. I queried file after file and sorted it for days, weeks and months. Tens, hundreds of thousands, millions of data points and suddenly, there it was sitting on my spreadsheet. 91.9% of our customers that took additional products had a profile that came from 47.8% of our client base.
I requested to cut my next marketing budget by 40%, stopped marketing the low value 52% of the client base and doubled the efforts on the 48% that took multiple products. The result, a 26% increase in profitability in my entire district. Wells Fargo still runs this program today, only with an army of employees and processors.
Nevertheless, I had found my edge and my efficiency buried in the numbers. That is the easiest definition of analytics. Ask the question: How does this help me get an edge to be better, to be more profitable, to be more efficient or to win more games? If you are given a number, and if it does not help you create an edge or advantage, it is a stat, not an analytic metric.
With the annual season of head coach and coordinator shuffling and renewals, how can analytics help give an athletic director an edge or advantage? Keep in mind, I do not view analytics as the decision maker, it is merely a tool in the box of due diligence to come to a conclusive decision. Nevertheless, the goal of analytics in a coach’s profile is to minimize risk and maximize potential.
There are several areas in which we have found analytics to be useful in the coach hire/fire/renewal processes:
1. Evaluating a current head coach for retention including a review of his progression/regression of key performance metrics (not stats), recruiting radius, player development and coordinator trends.
2. Filling a current head coach position
3. Beware the one hit wonder – Short term success versus long term viability
4. Understanding brand and program value (don’t bid against yourself)
5. Rewarding a new contract or extension based on expectations, value and performance
6. Who is your head coach hiring? Know who your head coach is hiring and setting your expectations for both the new hire and your head coach
7. Have a plan when performance starts to fade
Top Mass Index Development
One aspect of coach profiling we track is player development and in particular mass development. In the game of football, we have shown that force is a critical edge in performance at all levels of football. Taking out the new head coaches for 2018, here are the top 10 current head coaches for player development in our Mass Index. These coaches have seen the largest gains in year 1 & 2 vs year 3 & 4 sizes in their players for 2018. We see player development as important to overall coaching efficiency and many of the teams below are having results in 2018 well beyond their MWT expectations.
1. Purdue
2. North Texas
3. Old Dominion
4. New Mexico
5. Colorado
6. West Virginia
7. Appalachian State
8. Virginia
9. Wake Forest
10. East Carolina
Let’s take a look at a couple examples of how analytics viewed the decision a couple athletic directors had in the past few years and how the analytics would have given a red light or green light to the four decisions. These are just two charts of the several trends and metrics we utilize to grade coaches and coordinators. In these case studies we illustrate one of our favorite initial tools to examine a head coach, Modified Win Total or MWT.
MWT (Modified Win Total): Not all wins are equal. At Matrix Analytics Solutions we agree and have created a metric to express that. The Modified Win Total is a metric which measures the value of a win or a loss by placing value on roster talent, location of victory, and margin of victory relative to the expected outcome. For example, we at MAS believe a 4 point win over Alabama in Tuscoloosa should be viewed differently than a 20 point win against Alabama State. The MWT metric makes that distinction.
RTD (Roster Talent Discrepancy): Good coaching can’t be measured by wins and losses alone. A deeper dive into the roster talent a coach has relative to those he is facing helps in viewing a coach’s career with more clarity. That is what the RTD metric is illuminating.
Case Study A:
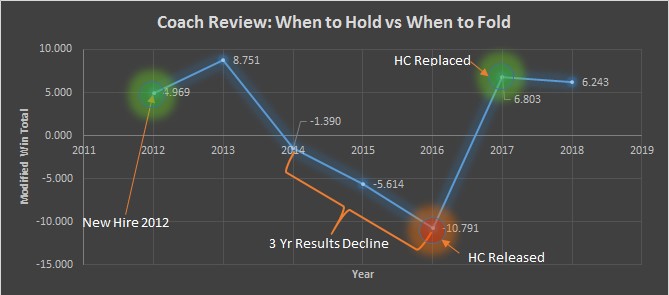
In this double study, you can see two excellent decisions by an athletic director in the chart above. He made a new hire for the program in 2012 and in year 1 and 2, the performance metrics were strong with solid MWT metrics. One of the critical aspects you do not see in the chart is the simultaneous decline of recruiting radius and player development which helps foretell the upcoming decline starting in year 3. After the results decline from 2014-2016, the AD made a replacement decision.
Too often, the process in the court of public opinion is graded on the hire alone. In this case, the hire/fire process was an outstanding dual choice. After the third, and worst year, the AD made the change and the impact was immediate. The head coach removed left with a career D grade and the head coach brought in was a career B+. Not only was a quality hire made, it was a tremendous value as he hired a top quartile risk and paid a bottom quartile price. It is now 2018 and the program, once in the Top 25 a decade ago, fell out and quickly returned.
Case Study B:
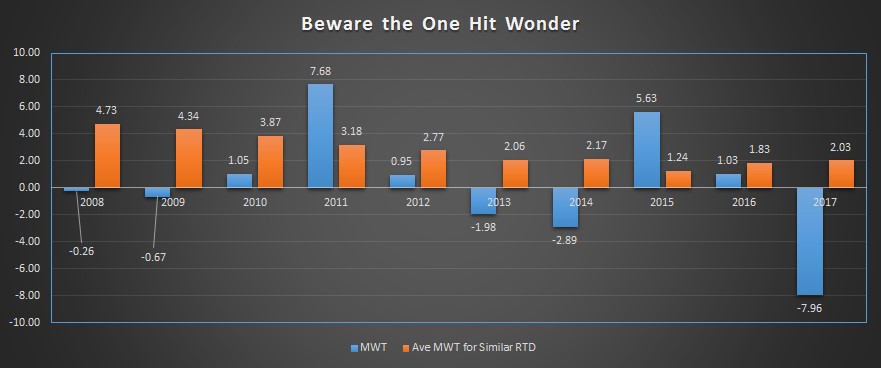
Beware of the one hit wonder. This is a profile of a program that took in a one-year wonder not once, but twice, in the new hire and in the renewal. In our chart above, you can see this head coach, in his first four years of head coaching had three subpar seasons from 2008-2010 and then a huge over performance of expectations in 2011. The years leading up to this big season did not show a strong progression of performance or recruiting to expect this meteoric rise.
Nevertheless, in 2011, a football program took him one based on this single year anomaly.
The first-year step back is normal as few new head coaches can adapt their culture and philosophy with expected success in the first season. His second year produced a career low in MWT followed by another career low in 2014. Somehow, on a contract year, another one-year wonder was produced and this prompted a raise, extension and a large buy out. Two years later, the MWT is at an all-time low and, what you cannot see is the pace for an even worse season in 2018. Nine years as a head coach and just two seasons above the expected win total for his schedule and talent level.
We all know that hiring is a risk, no matter who it is, with the exception of the rare occurrence of a new hire being the guy everyone wanted unequivocally. In this case study, risk could have been reduced and reward could have been a higher potential with other candidates. Athletic directors can use the big picture metrics to reduce risk and put themselves in a position of greater knowledge to negotiate better terms and reduce risk in the hire, track, fire processes.
Best Practice: Recruiting Radius
We can all agree, at any level, recruiting is the life blood of the program. However, it is a skill set not gifted to every head coach. In our research, without significant changes to infrastructure and culture, most programs recruit with a certain range of player. For a program, the first aspect of a program that starts to erode is often recruiting.
To track recruiting effort and success, we suggest you track “recruiting radius” or how far is the average recruit from home. There is a very strong correlation of improved recruiting and talent stratification when we see a head coach start to stretch out his recruiting radius. It is essentially working harder and traveling further for another level of player rather than settling for the closest options. On the reverse side, a decline in recruiting radius could be the signal of a coach that does not want to put the time in to retain the average level of recruited talent or is simply burned out. It is easy to track by using your roster and signed class to determine the past, present and trending recruiting radius of your staff.
Matrix Analytical Solutions is a analytics firm focused on creating customized edges and risk/reward analytics for athletic directors and head football coaches including all phases of the coaching search and performance monitoring. Follow them on twitter @AthDeptEdges. The managing partner, Dave Bartoo can be reached at 503.504.8710.