

With the 2022 College Baseball World Series finals taking place later this week in Omaha, AthleticDirectorU is proud to present an in-depth study of Division-I baseball expenses.
The eight programs that reached Omaha this year — Notre Dame, Texas, Texas A&M, Oklahoma, Stanford, Arkansas, Ole Miss and Auburn — all hail from the sport’s wealthy Power Five conferences. Unsurprisingly, each of the eight programs are among college baseball’s top 60 biggest spenders over the last half decade according to our study, including six of the top 15.
Previous ADU studies of FBS football and men’s basketball budgets revealed disproportional spending among the country’s elite programs compared to the national average.
On the gridiron, national FBS expenses had nearly tripled from 2003 to 2018, making for nearly 30 percent of an entire school’s athletic budget in our most recent study. Alabama’s $60.43M annual expenses from 2014 to 2018 more than doubled the national average of $22M.
As for college hoops, the average men’s basketball program spent over $4M in 2018 with each of the Power-Five conferences exceeding $5M in average expenses. Duke, Kentucky and Louisville all exceeded $90M total expenses during a five-year period from 2014 to 2018.
Operating expenses, otherwise known as gameday expenses, include money attributable to lodging, meals, transportation, uniforms, equipment, team members, support staff and more, as defined by the U.S. Department of Education’s EADA database. These are the primary financial numbers used throughout this study.
Let’s dive into baseball’s operating expenses and how they have changed in recent years.

The COVID-19 pandemic left a substantial impact on college baseball. Boise State, Chicago State, Furman, La Salle and NC Central have all discontinued their baseball programs since 2020, largely citing pandemic-related budgetary constraints in official press releases.
As seen in the chart above, national baseball expenses dipped approximately 30 percent nationally in 2021, the first full season since COVID-19. The 2019 annual expenses reached an all-time high at over $438,000, nearly double the national average 10 years prior.
Overall, the SEC leads the nation in baseball investment. In the last five seasons, the SEC is the only conference averaging seven figures in baseball operating expenses. While the Big 12 comes in at a close second, the financial dropoff after the top two leagues is substantial. The Big Ten, checking in at No. 5 in spending, averages roughly half of the SEC’s baseball investment per program in operating expenses.
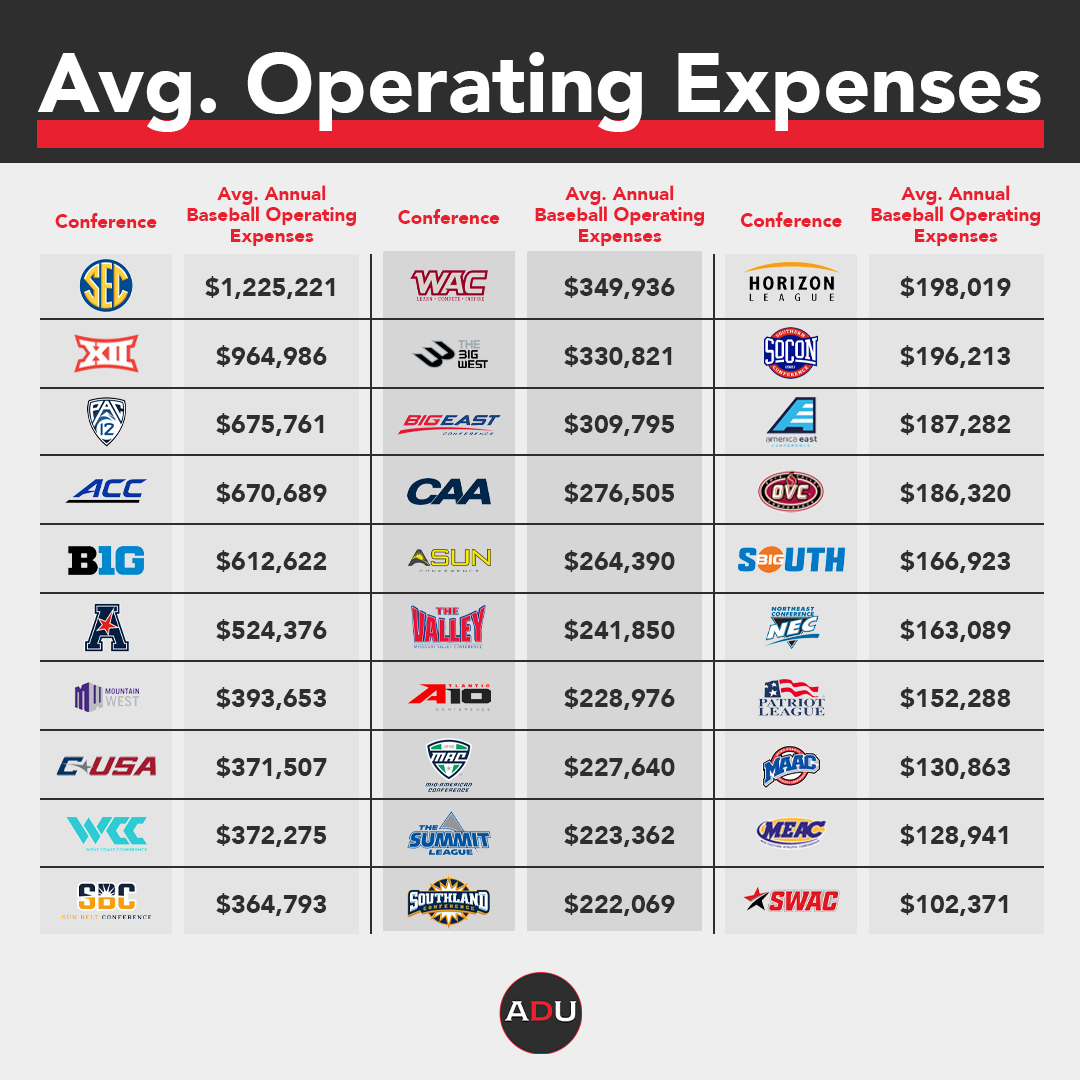
The Sun Belt checks in at No. 10 on the national spending list as one of the stronger mid-major baseball conferences. With Coastal Carolina and a stable group of fellow competitors, the traditional one-bid basketball conference sent four teams to the 2022 NCAA Baseball Tournament and has recorded multiple bids three times since 2016.
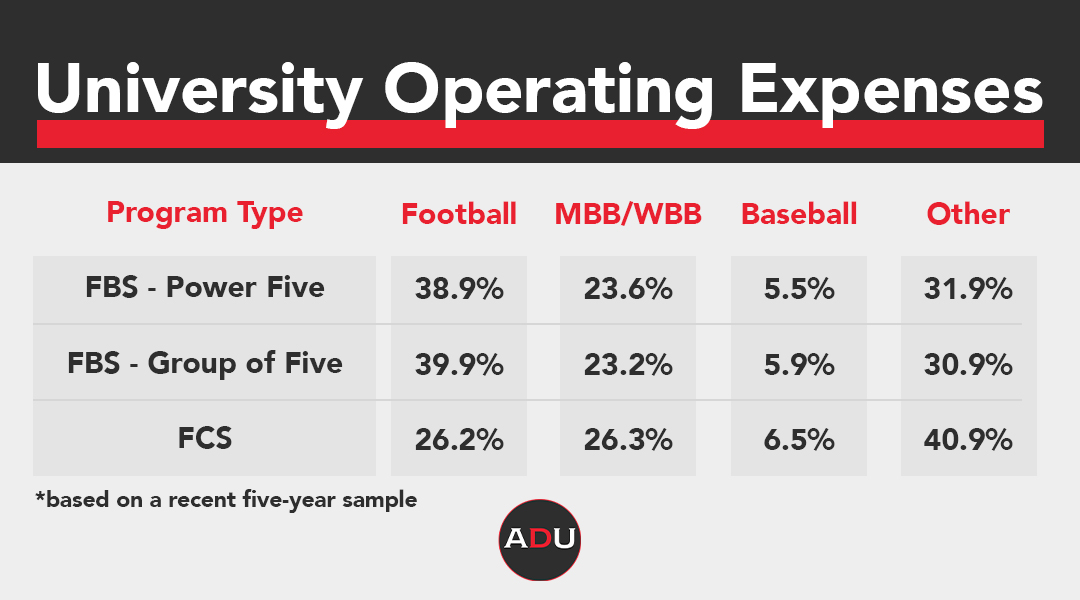
Overall, baseball, on average, makes up roughly six percent of overall university athletic operating expenses based on a recent five-year sample.
Outliers exist, though. Between 2014 and 2018, three universities — Coastal Carolina, The Citadel and Northwestern State — dedicated more than 14 percent of their proportional athletic operational expenses on baseball. Below are the highest proportional spenders from the five-year window.
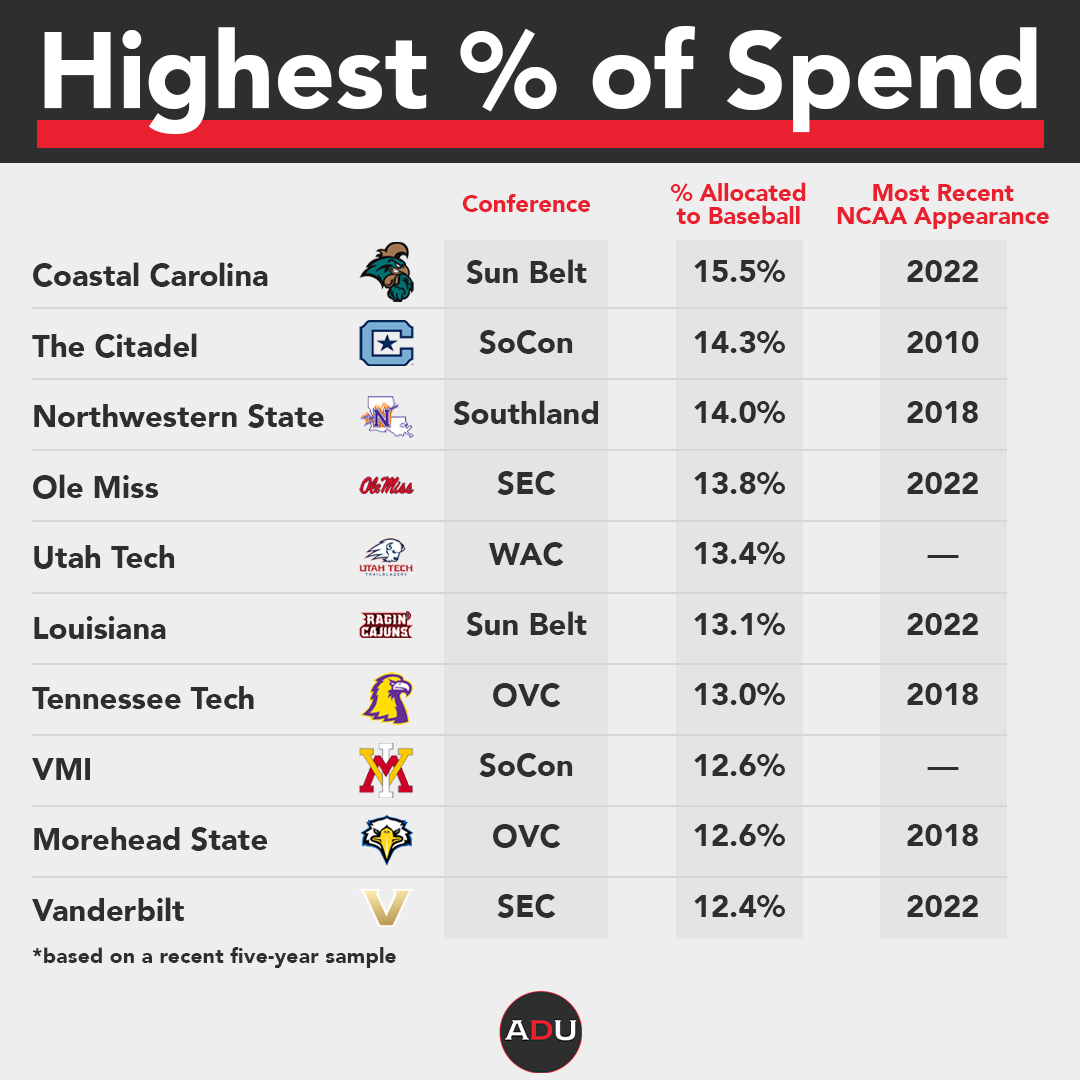
With a heavy institutional investment, Coastal Carolina has evolved into a national baseball powerhouse over the past two decades. Led by longtime head coach Gary Gilmore, the Chanticleers have made 16 NCAA Regional appearances and three Super Regionals while capturing the 2016 national championship. Coastal Carolina is the only non-Power Five program to win the College Baseball World Series since Fresno State’s 2008 title.
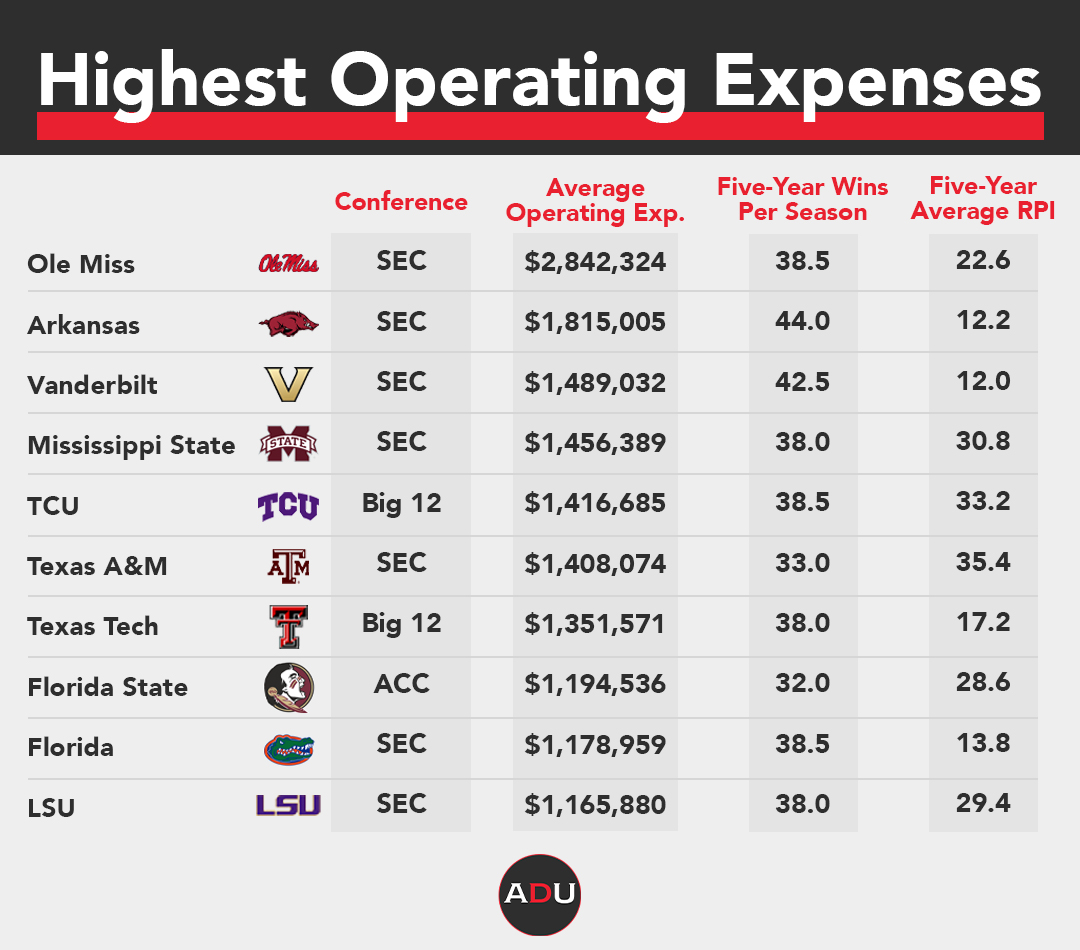
While Coastal Carolina owns the highest proportional investment, the SEC dominates in overall baseball investment. The conference is responsible for seven of the top 10 programs in operating expenses with Ole Miss leading the way at over $2 million a year.
It’s not all about the big spenders, though. Plenty of programs have displayed continued success despite smaller budgets. Below are the programs with the lowest “cost-per-win” averages over the last five years among teams with top-100 RPI averages. Nationally, the average “cost per win” during this span was $14,412 with 50 teams exceeding $20,000 per victory.
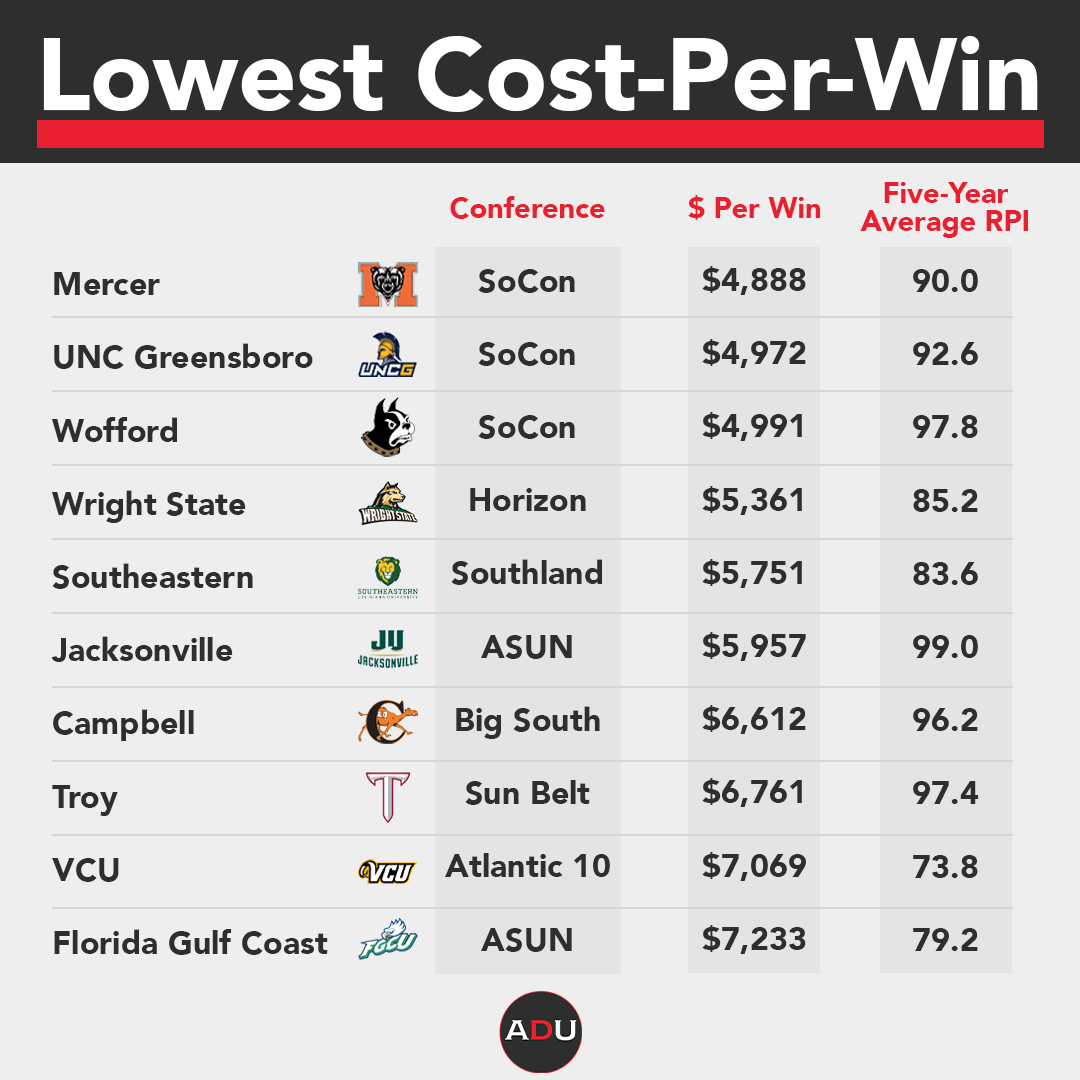
The SoCon doesn’t have a single program among the nation’s top 100 spenders over the past five years. However, four SoCon programs — Samford, Mercer, UNCG and Wofford — boast top-100 RPI ranking averages during the same span.
Significant financial investment is highly correlated with NCAA Tournament representation. Through our five-year study, at-large teams averaged $862,327 in annual operating expenses compared to $441,634 for automatic bids. The discrepancy is largely due to Power Five programs making up the vast majority of at-large bids.
The table below shows a breakdown of at-large teams from the past five NCAA Tournaments based on average annual operating expenses.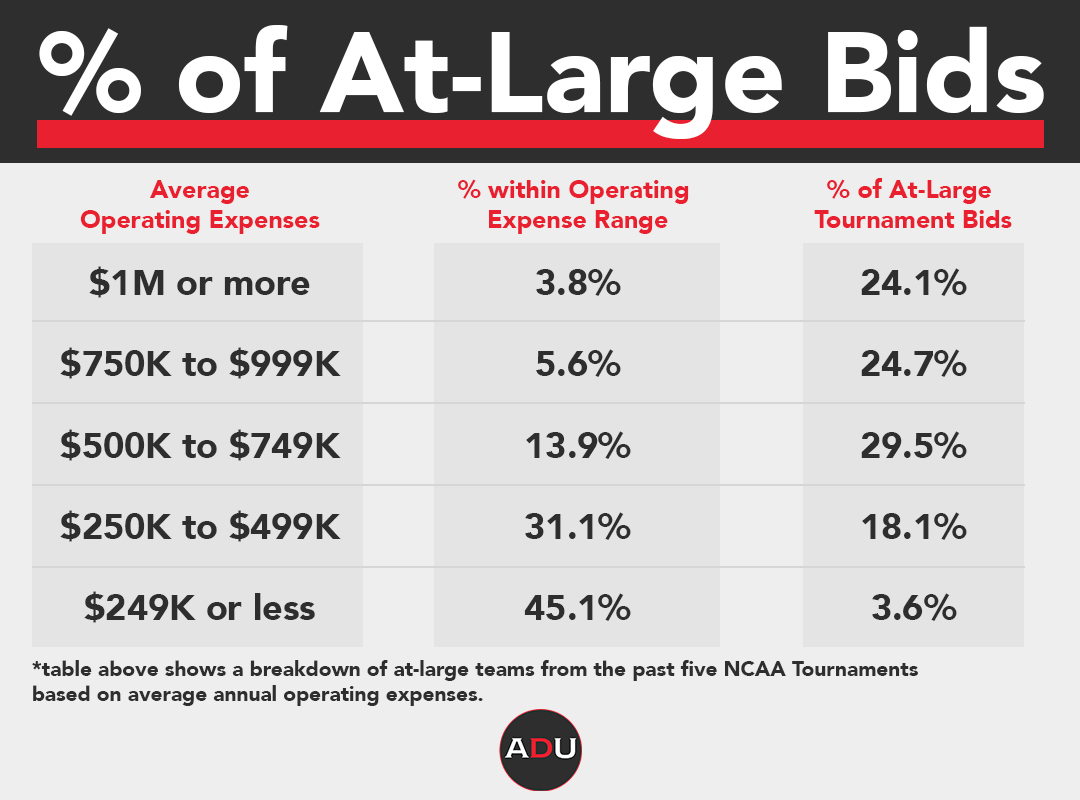
At the top, just 23.3 percent of NCAA baseball programs averaged at least $500,000 in annual operating expenses during our study. However, 78.3 percent of at-large bids over the last five tournaments went to programs with at least $500,000 in annual operating expenses.
While nearly half of NCAA baseball averaged less than $250K in average annual expenses, those teams made up just 3.6 percent of at-large bids during our five-year study. Tennessee Tech, Campbell, Troy, Southeastern Louisiana, Jacksonville and Fairfield are among the programs with the smallest budgets that still managed to carve out at-large bids in recent seasons.
While baseball, like most Division-I sports, is largely dominated by the wealthiest programs, there are still instances of programs that have either made bold proportional baseball investments or made the very most of their modest budgets. Understanding how marginal growth can be realized or where incremental investments should be made can ultimately be the difference between missing out on the tournament or making the elusive trip to Omaha.