

Though baseball dons the title as “America’s pastime,” football has long been the nation’s lifeblood. The Super Bowl continues to see record-breaking ticket prices and advertising dollars while the college game’s financial involvement is at an all-time high.
As the country battles the effects of COVID-19, football plays a pivotal role in stabilizing college athletic finances. While there may be gripes about the attention and supposed preferential treatment football receives, it’s worth acknowledging its importance towards sponsoring and funding sports that would otherwise struggle to exist.
Using data compiled from the U.S. Department of Education and Sports-Reference’s Simple Rating System (SRS) metric — which measures team quality based on point differential and schedule strength — we are able to analyze college football’s finances and particular conferences or schools that buck national trends.
To begin, the chart below shows how average annual FBS football program expenses have increased over the years. Since 2003 through 2018 (the most recent available financial data set), average FBS expenses have nearly tripled from 7.5M to over $22M.
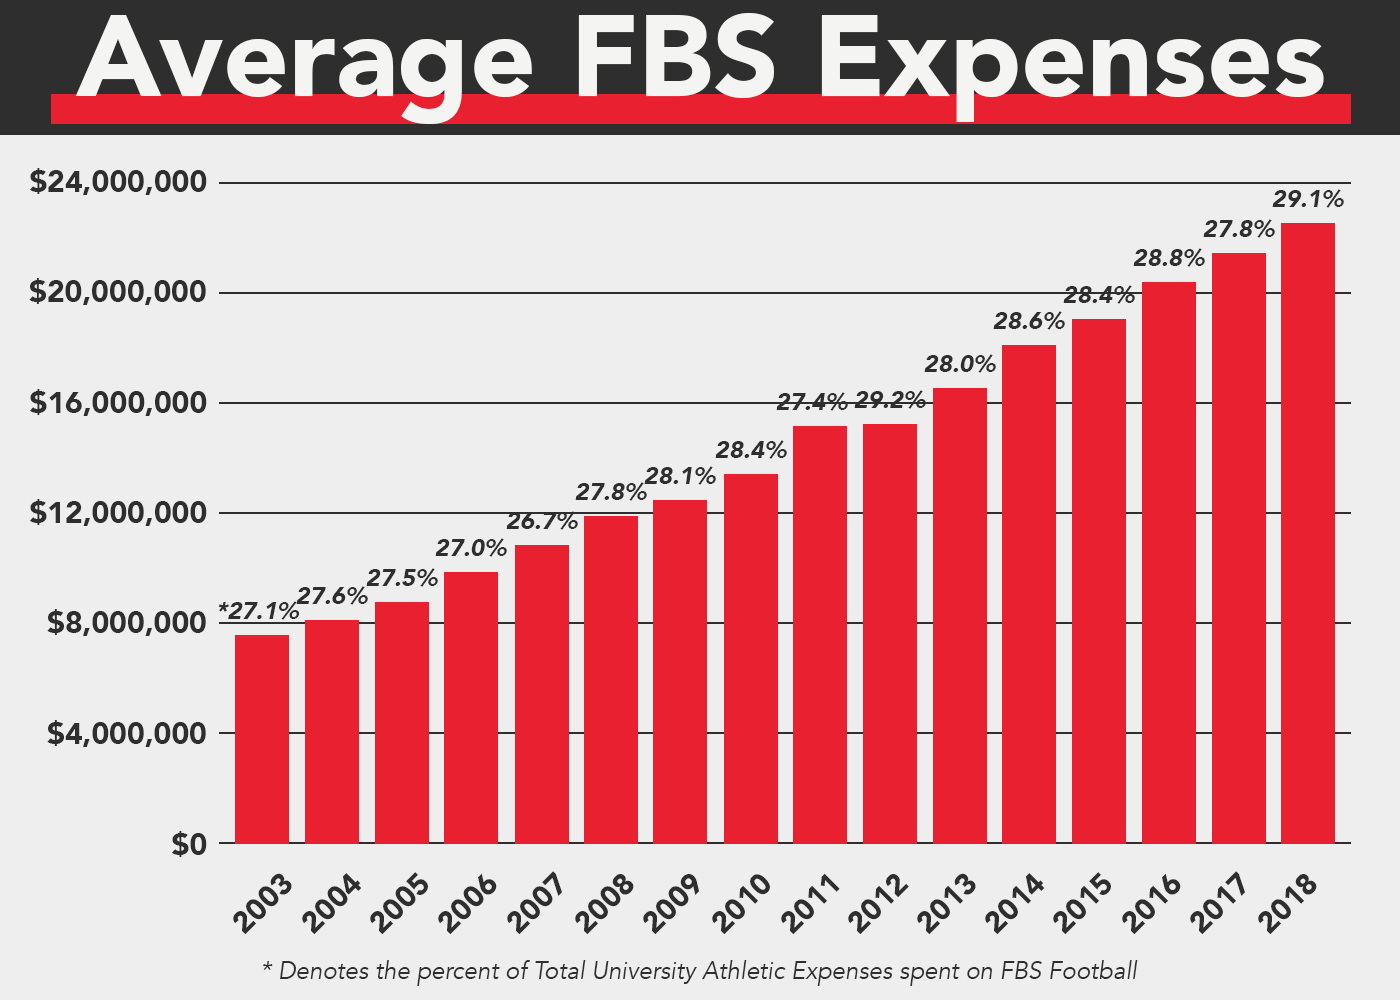
However, athletic budget increases are commonplace throughout most sports and not just football. Though football nearly makes up 30 percent of the entire athletic budget of the average FBS institution, football’s proportional budget compared to other sports has only slightly increased over the past 15 years from 27.08 percent to 29.09 percent.
Below you will find college football’s 15 biggest spenders over the past five seasons. Alabama has distanced itself from the rest of the pack with over $60M spent annually. SEC programs make up five of the top 11 spenders.
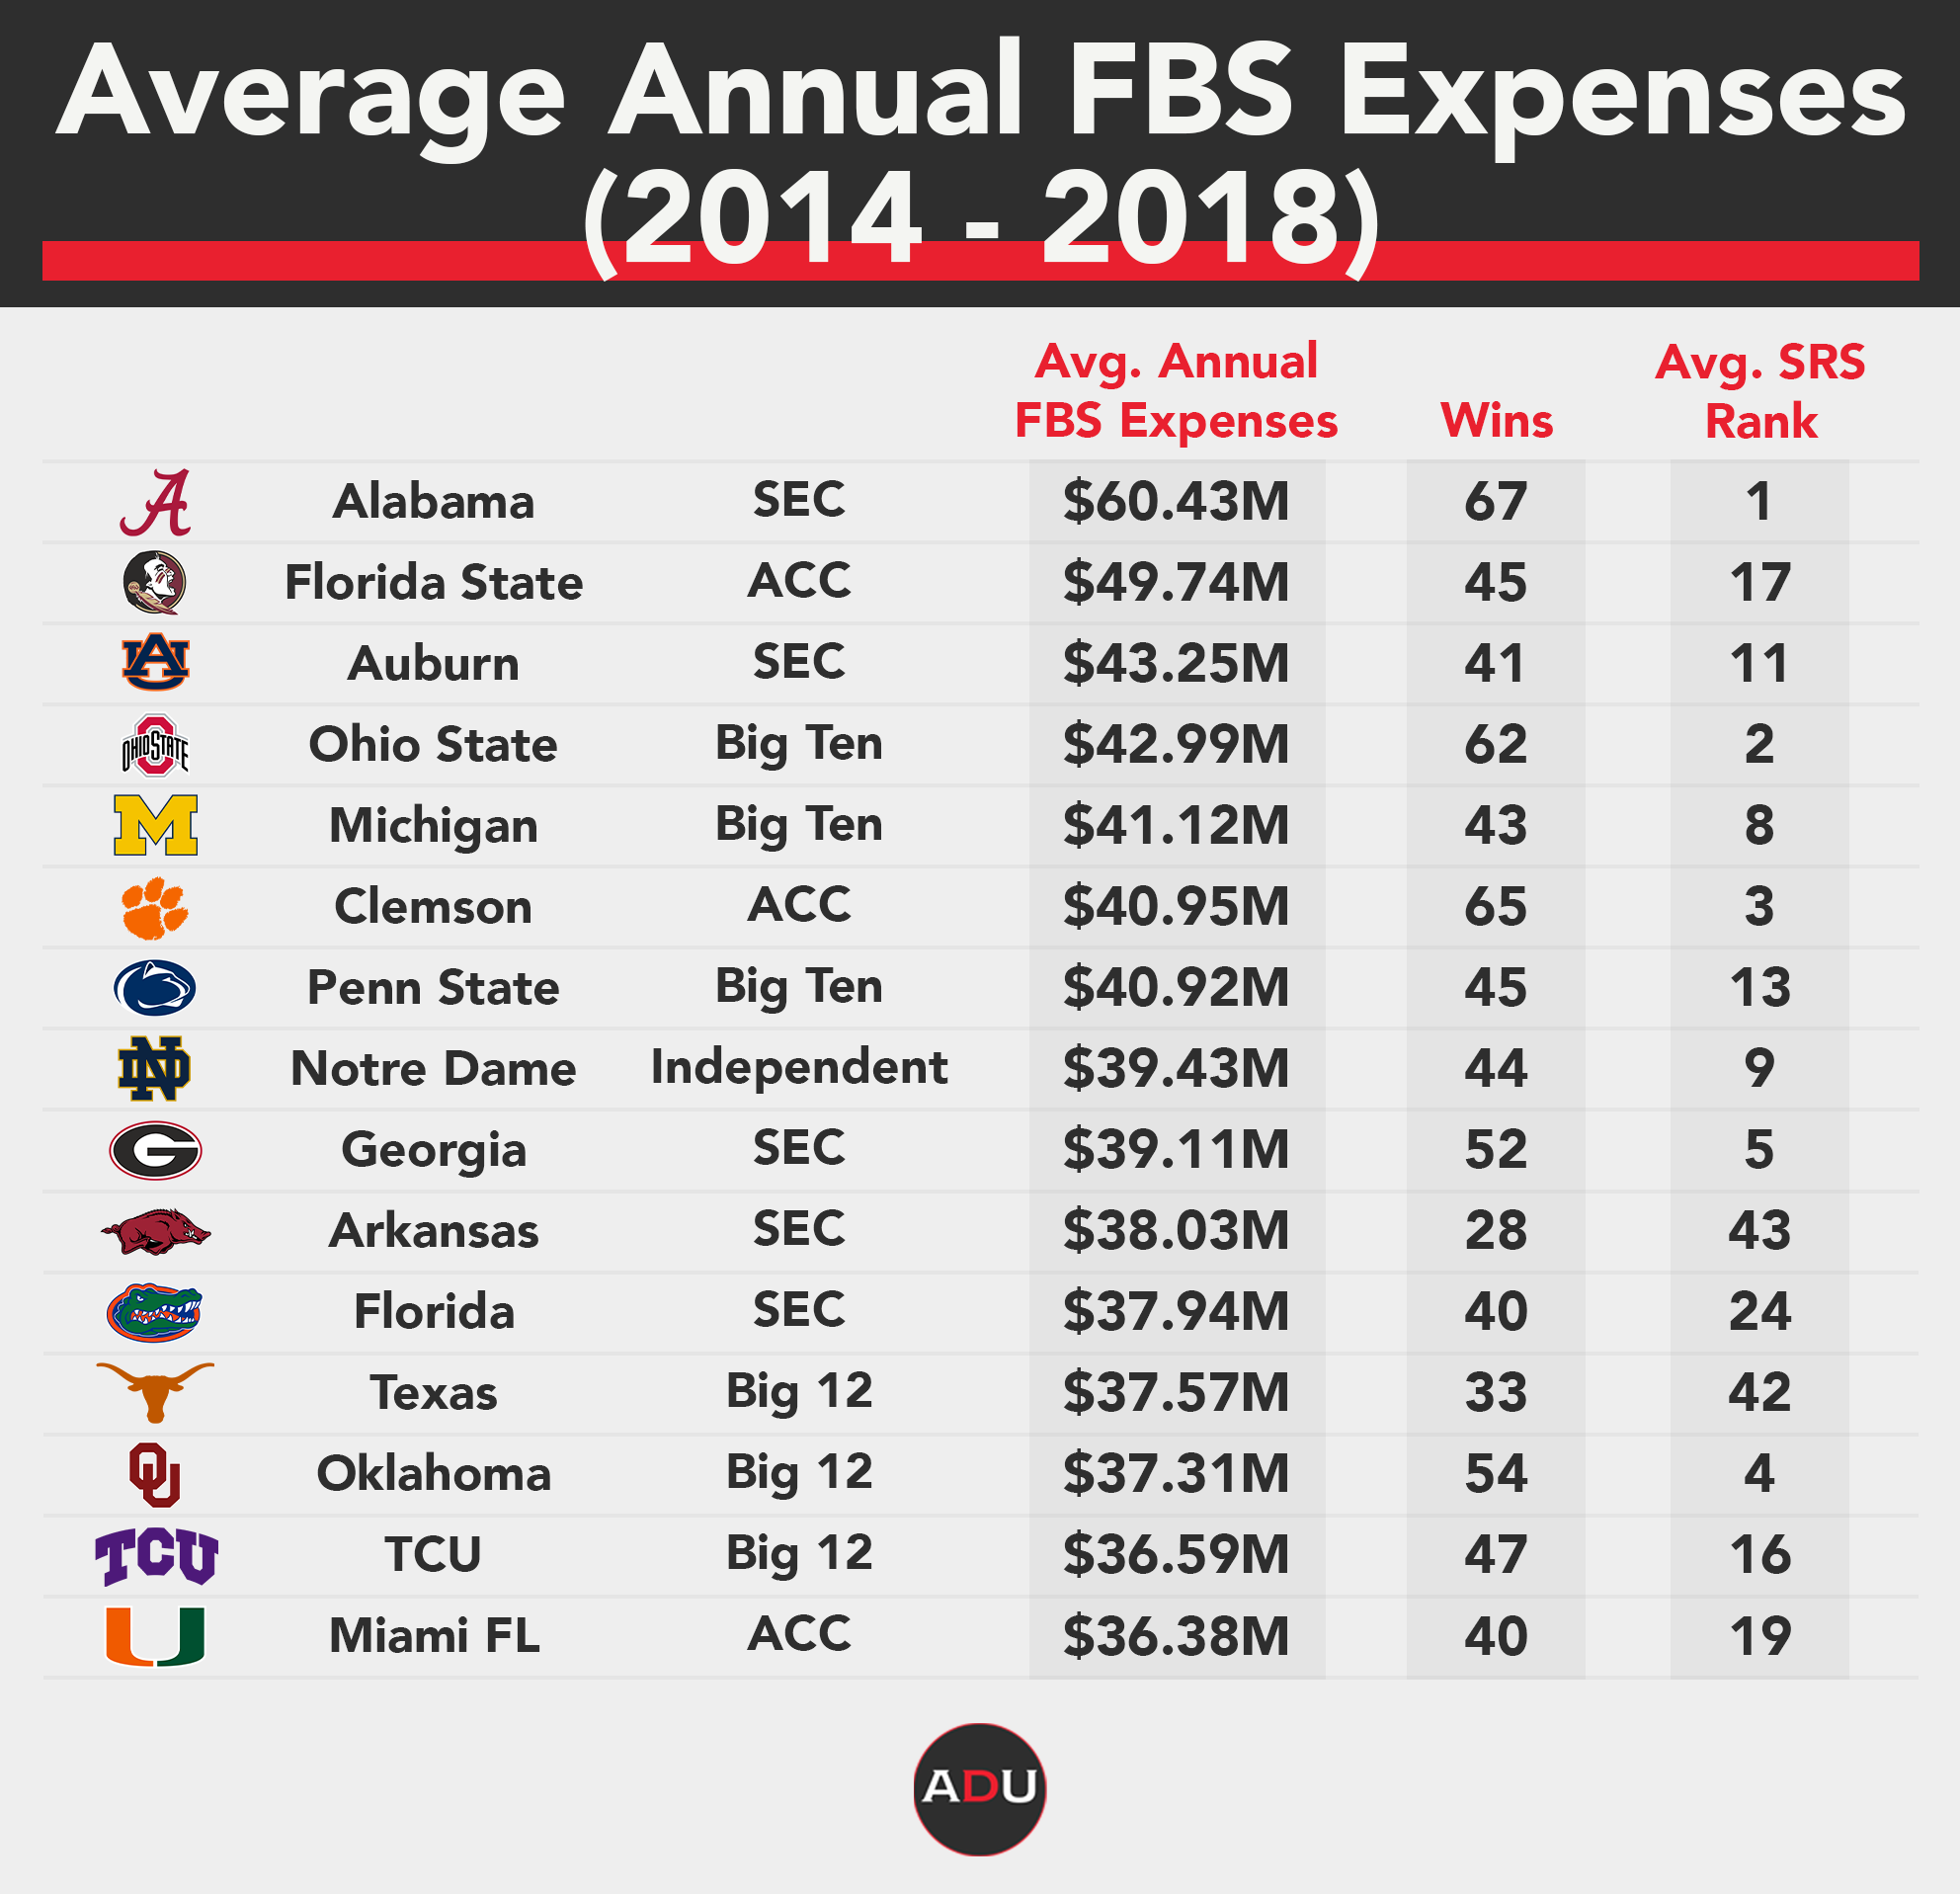
Based on data in the above table, it should be no surprise that the SEC has the largest average conference budget in all of FBS football, and it has translated into 19 New Year’s Six (NY6) bowls from 2014 to 2018, the most in the nation.
The correlation between budget and on-field performance is much stronger in football than in men’s basketball, for example, where teams outside of the high-major label can enjoy sustained success.
From 2014 to 2018, excluding Notre Dame (an Independent football member), only five of the 70 NY6 bowl appearances were made by non-Power Five programs. These five programs were a combined 59-3 prior to their NY6 bowl, again proving the near perfection required for FBS’ smaller schools to participate in major bowl games.
The table below orders each of the 10 FBS conferences based on average expenses by its programs from 2014 to 2018, as well the conferences’ biggest overall spender, NY6 bowl appearances, and increase in conference expenses from 2014 to 2018.
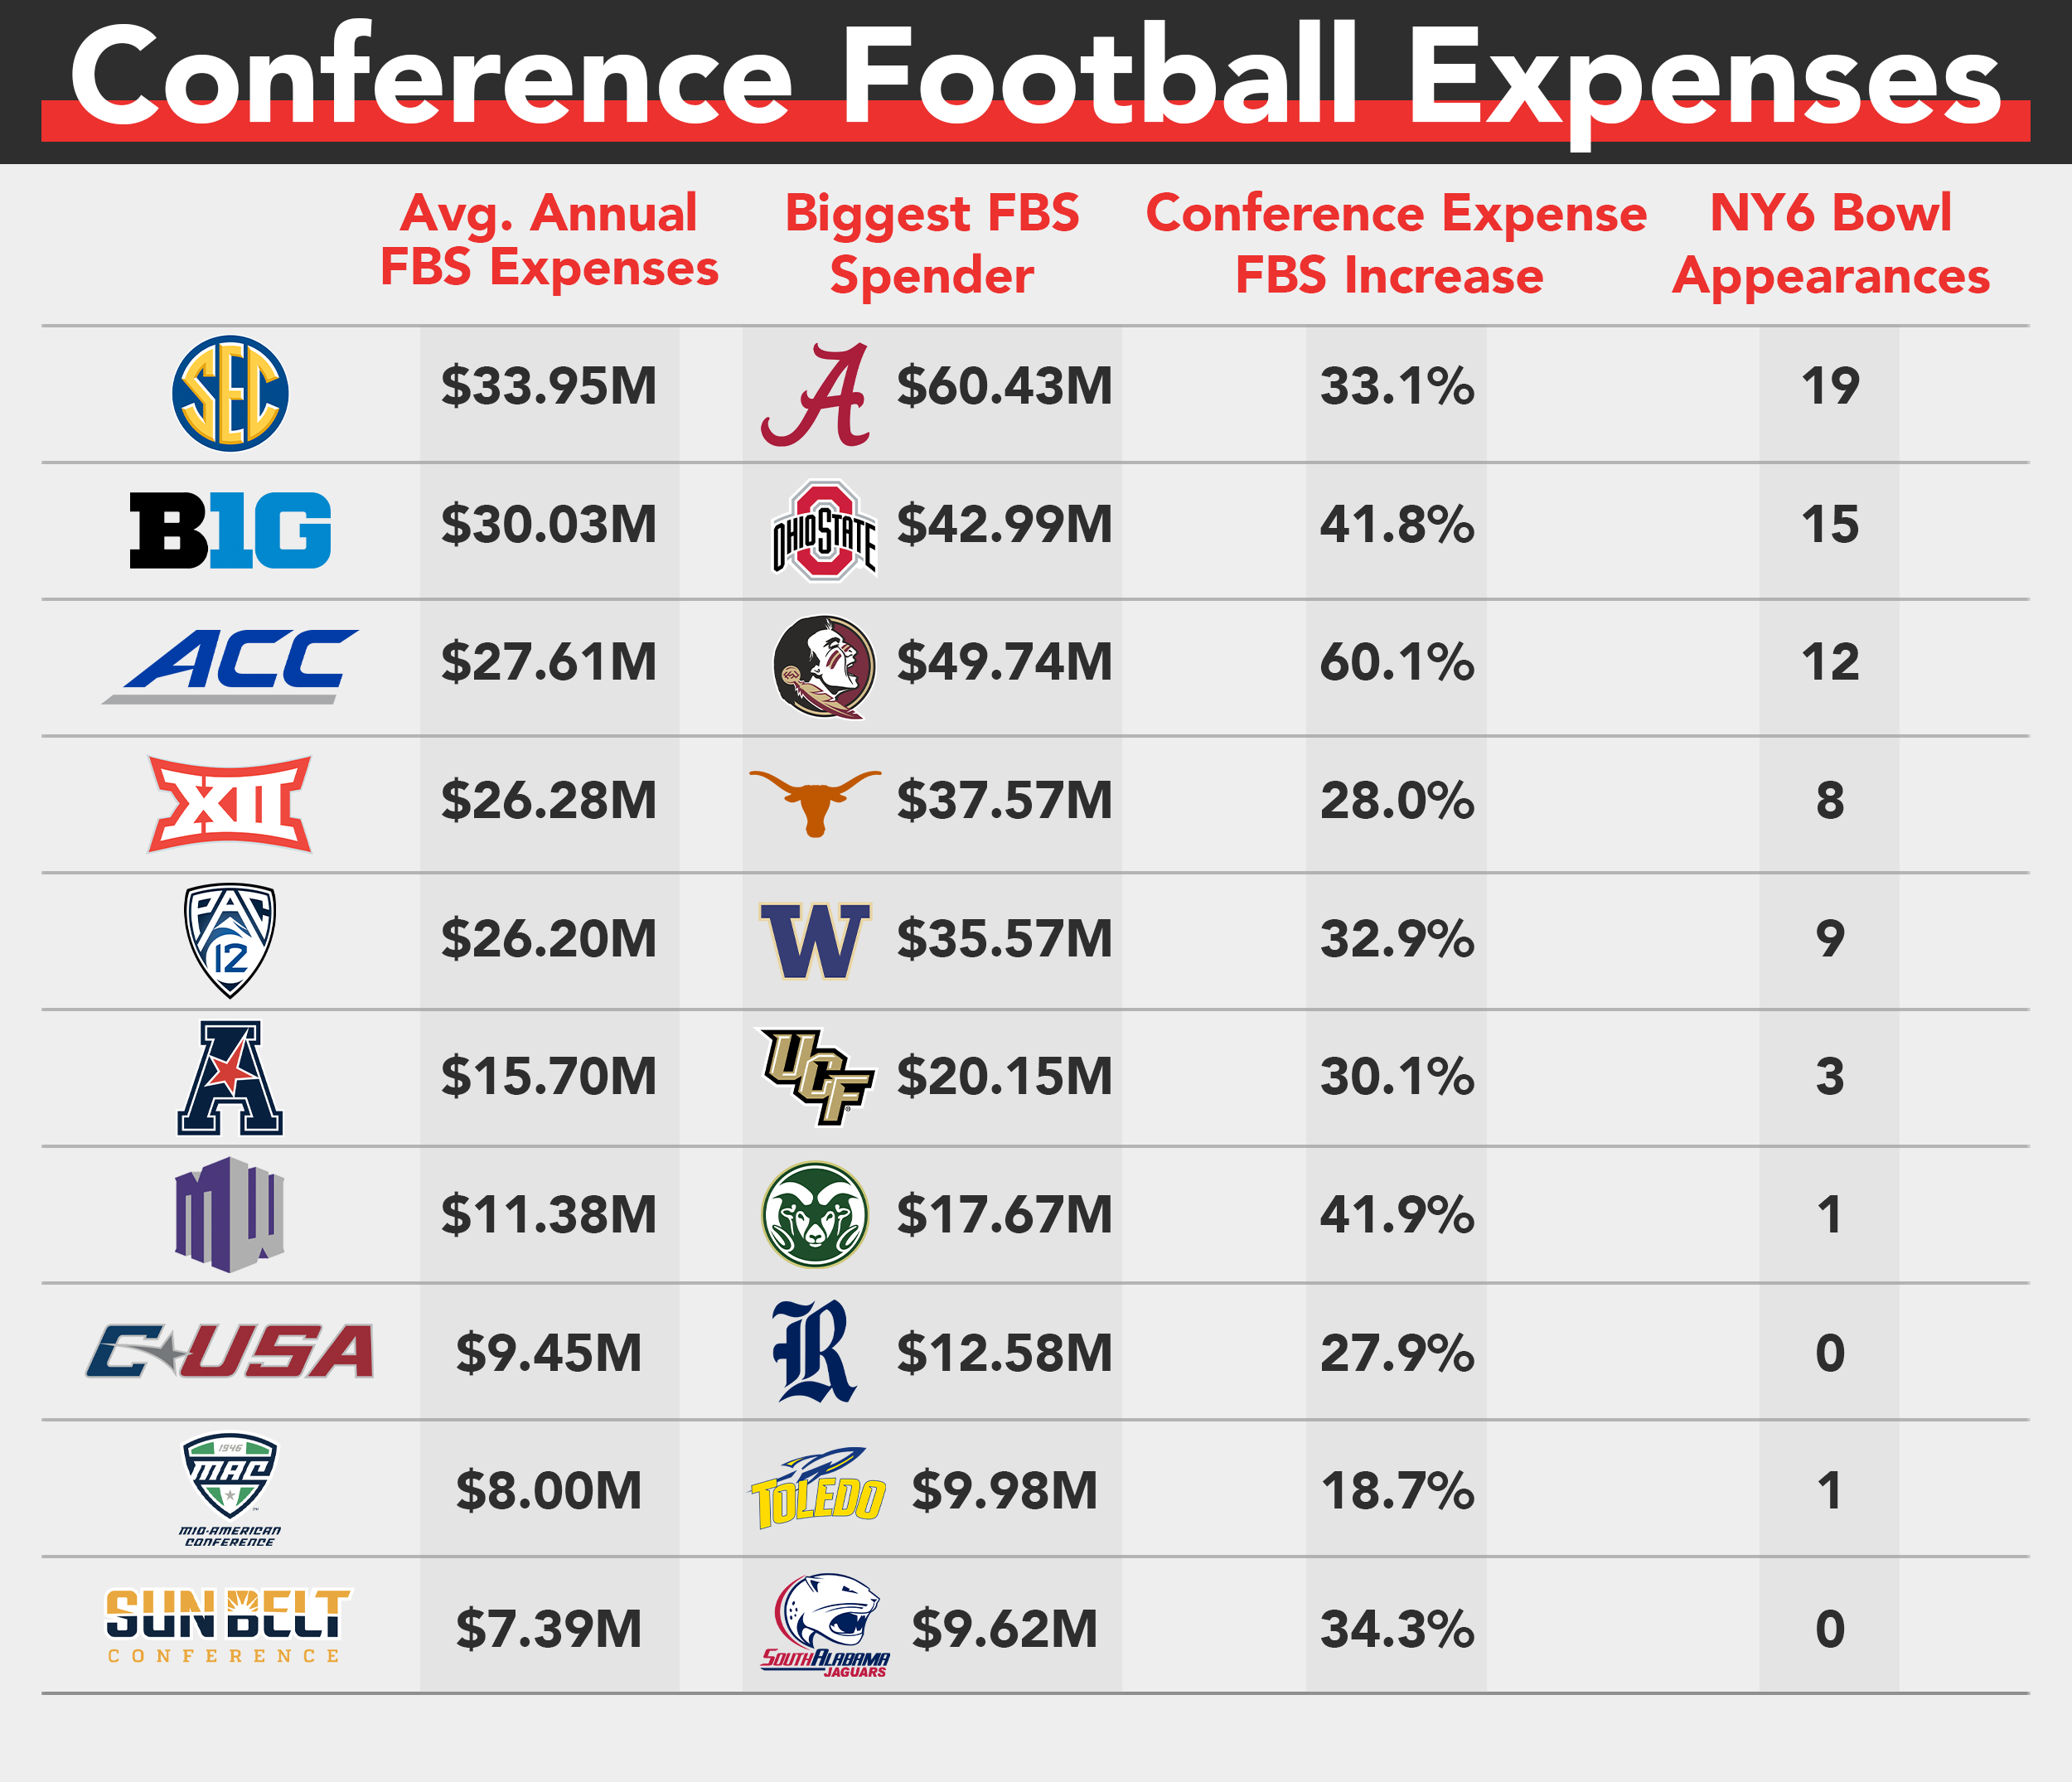
While the data above might not be entirely surprising, conference expense increases show a strong indication of where certain leagues are headed in the near future.
The ACC has seen a dramatic increase in overall conference expenses since 2014. While FSU remains the conference’s biggest spender, Clemson has appeared in four of the last six national championships. Louisville, which ranks third nationally in men’s basketball expenses, has experienced the largest proportional uptick in football expenses since 2014 at 136.1 percent. Four of the top five proportional increases are ACC programs, which supports the 60.1 percent conference-wide increase in the previous table.
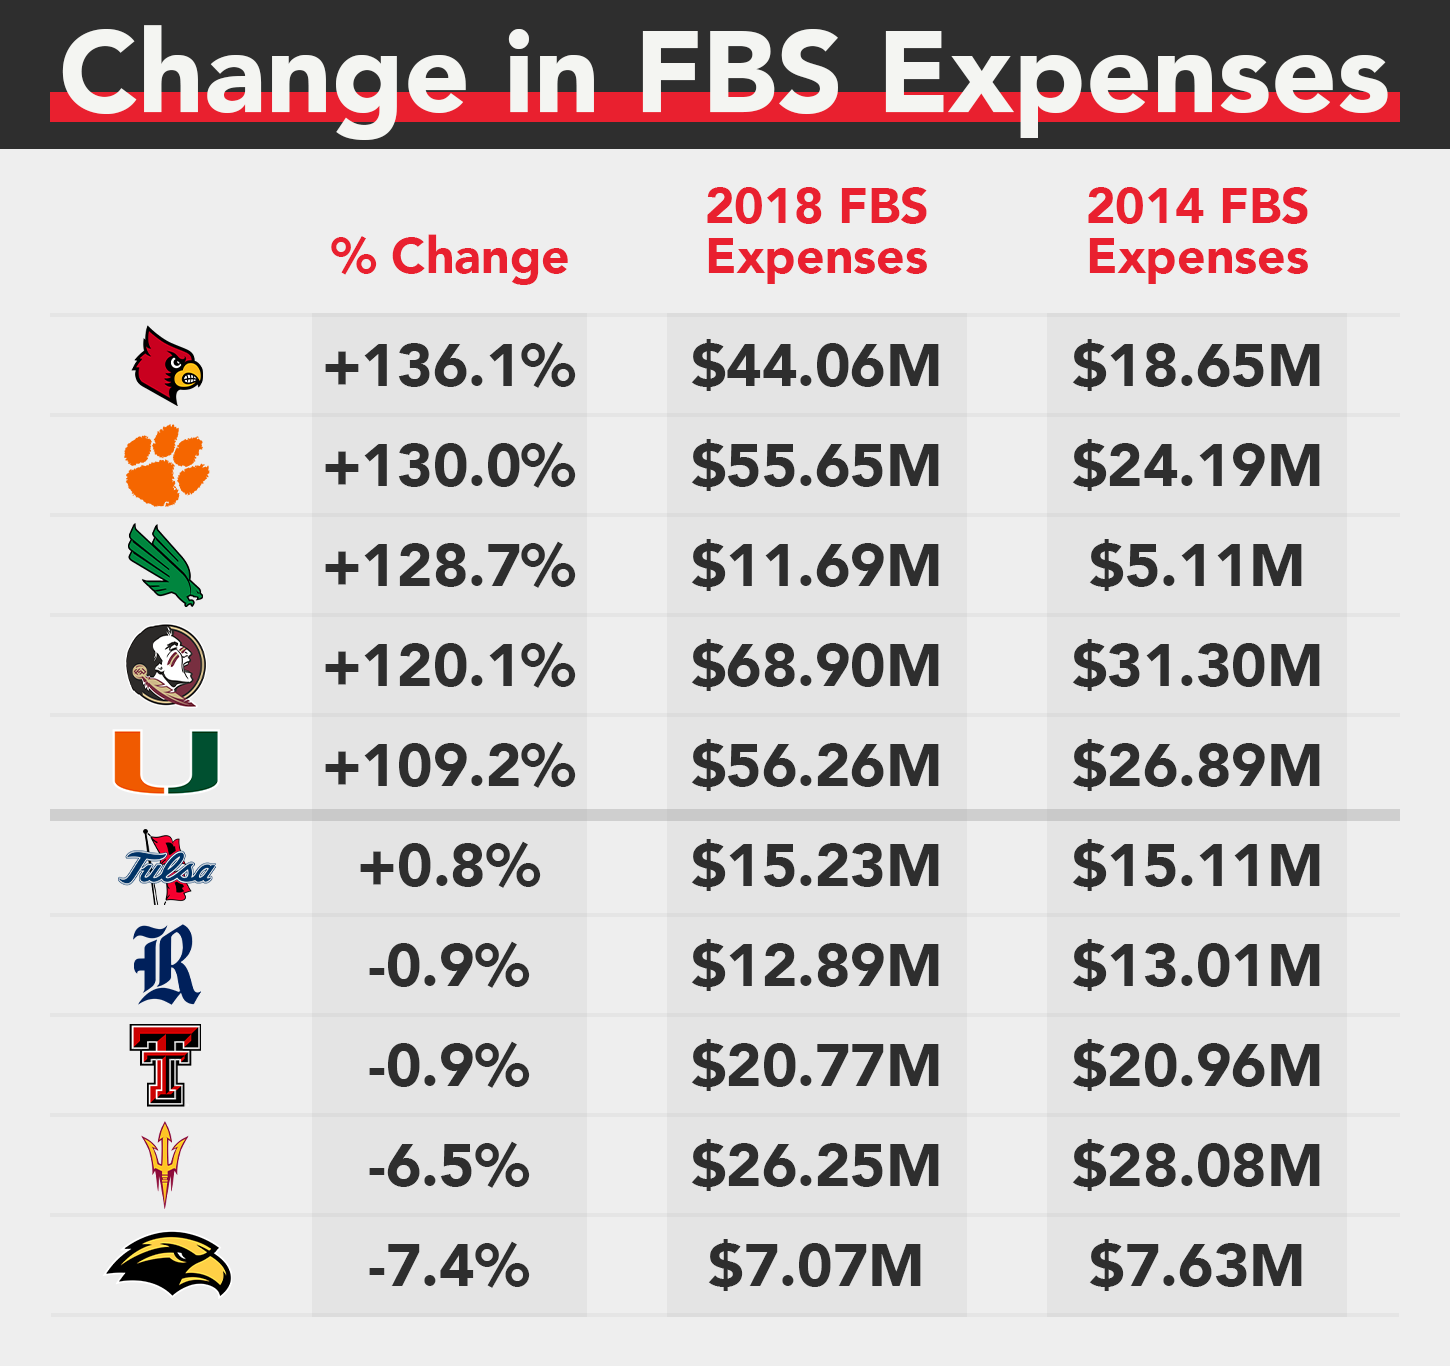
Despite FBS expenses increasing substantially over the last five years, there are still four programs that spent less in 2018 than in 2014. Two of the four teams are Power Five programs in Texas Tech and Arizona State, both of which have had multiple coaching changes since 2011.
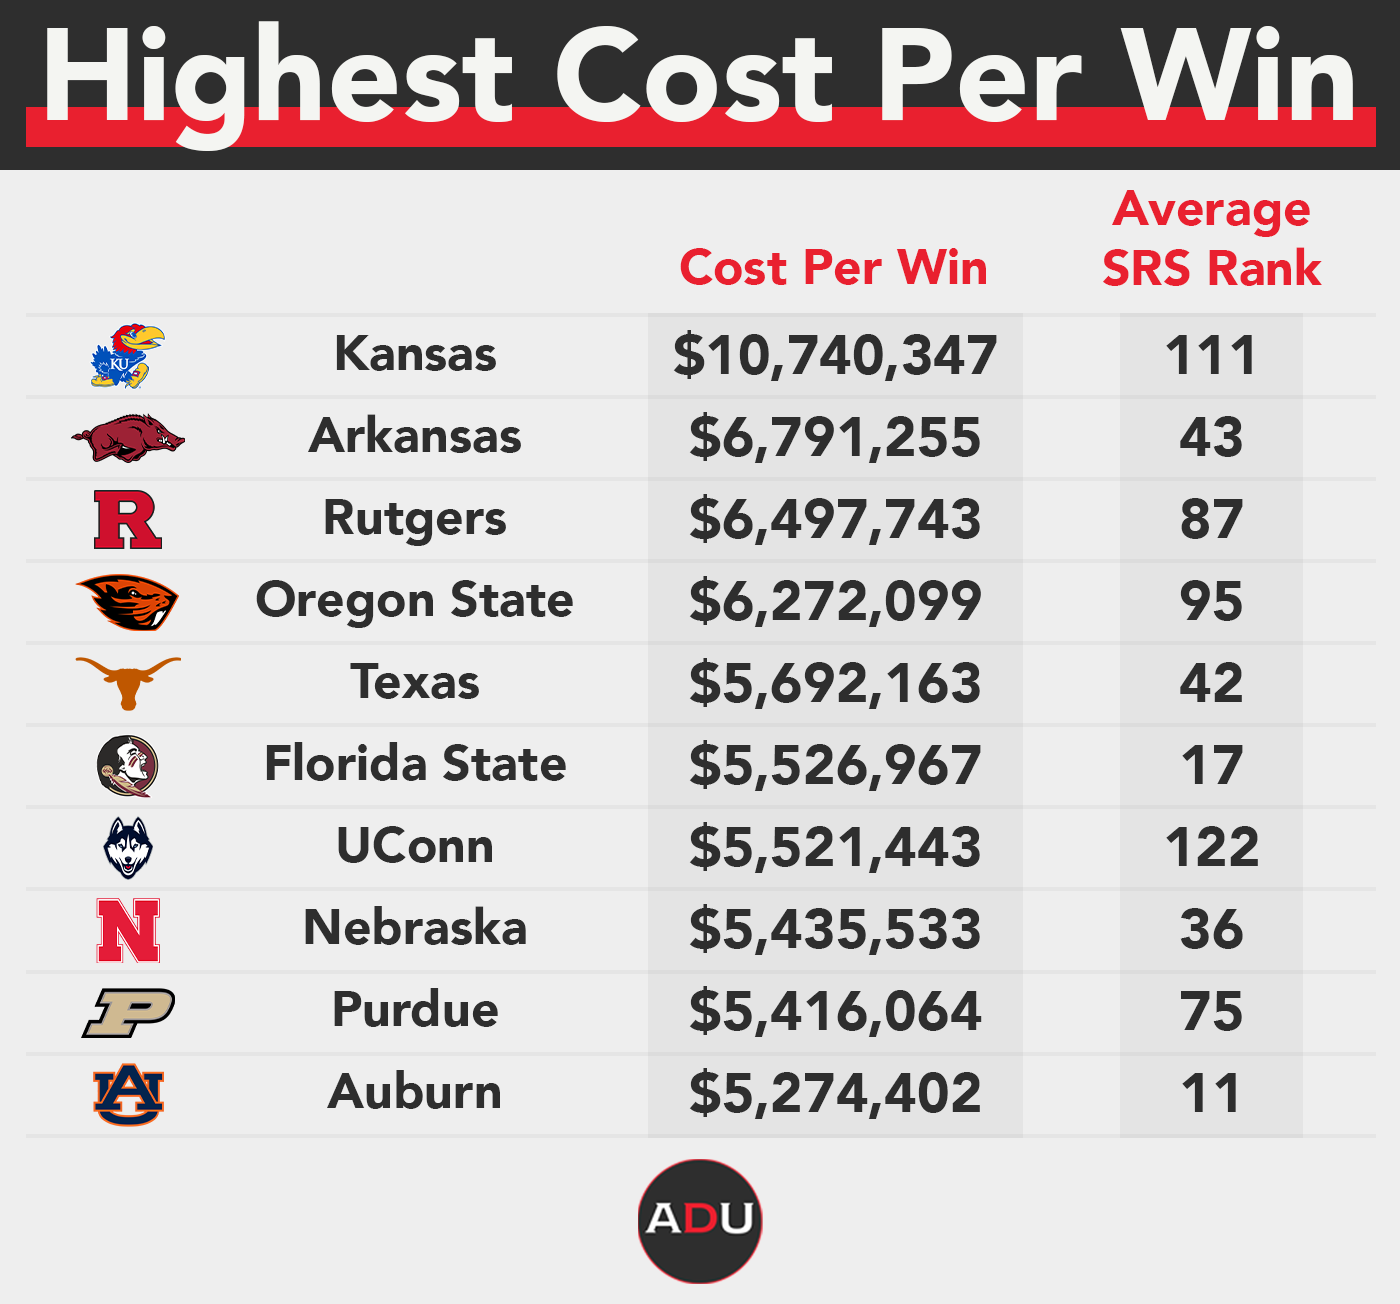
Cost-per-win measures can provide insights into how programs are performing relative to their budget. From 2014 to 2018, the average cost per win — total expenses divided by total wins — was $3,544,999. This means that over the five-year span, the average team would spend approximately $21,269,994 for six wins, which is the standard requirement for postseason bowl eligibility. As seen above, only the Power Five conferences recorded average expenses over $21M from 2014 to 2018, which would suggest that most Group of Five (G5) programs outperform their budgets when achieving bowl eligibility.
This number fluctuates considerably across the country, however, with some programs recording cost-per-win measures below $1M and others above $5M. Kansas’ cost-per-win average over this five-year span is nearly $4M more than any other FBS program at over $10M. Since Mark Mangino’s resignation after the 2009 season, Kansas has won no more than three games in a single season and its cost-per-win measure tops the nation as a result.
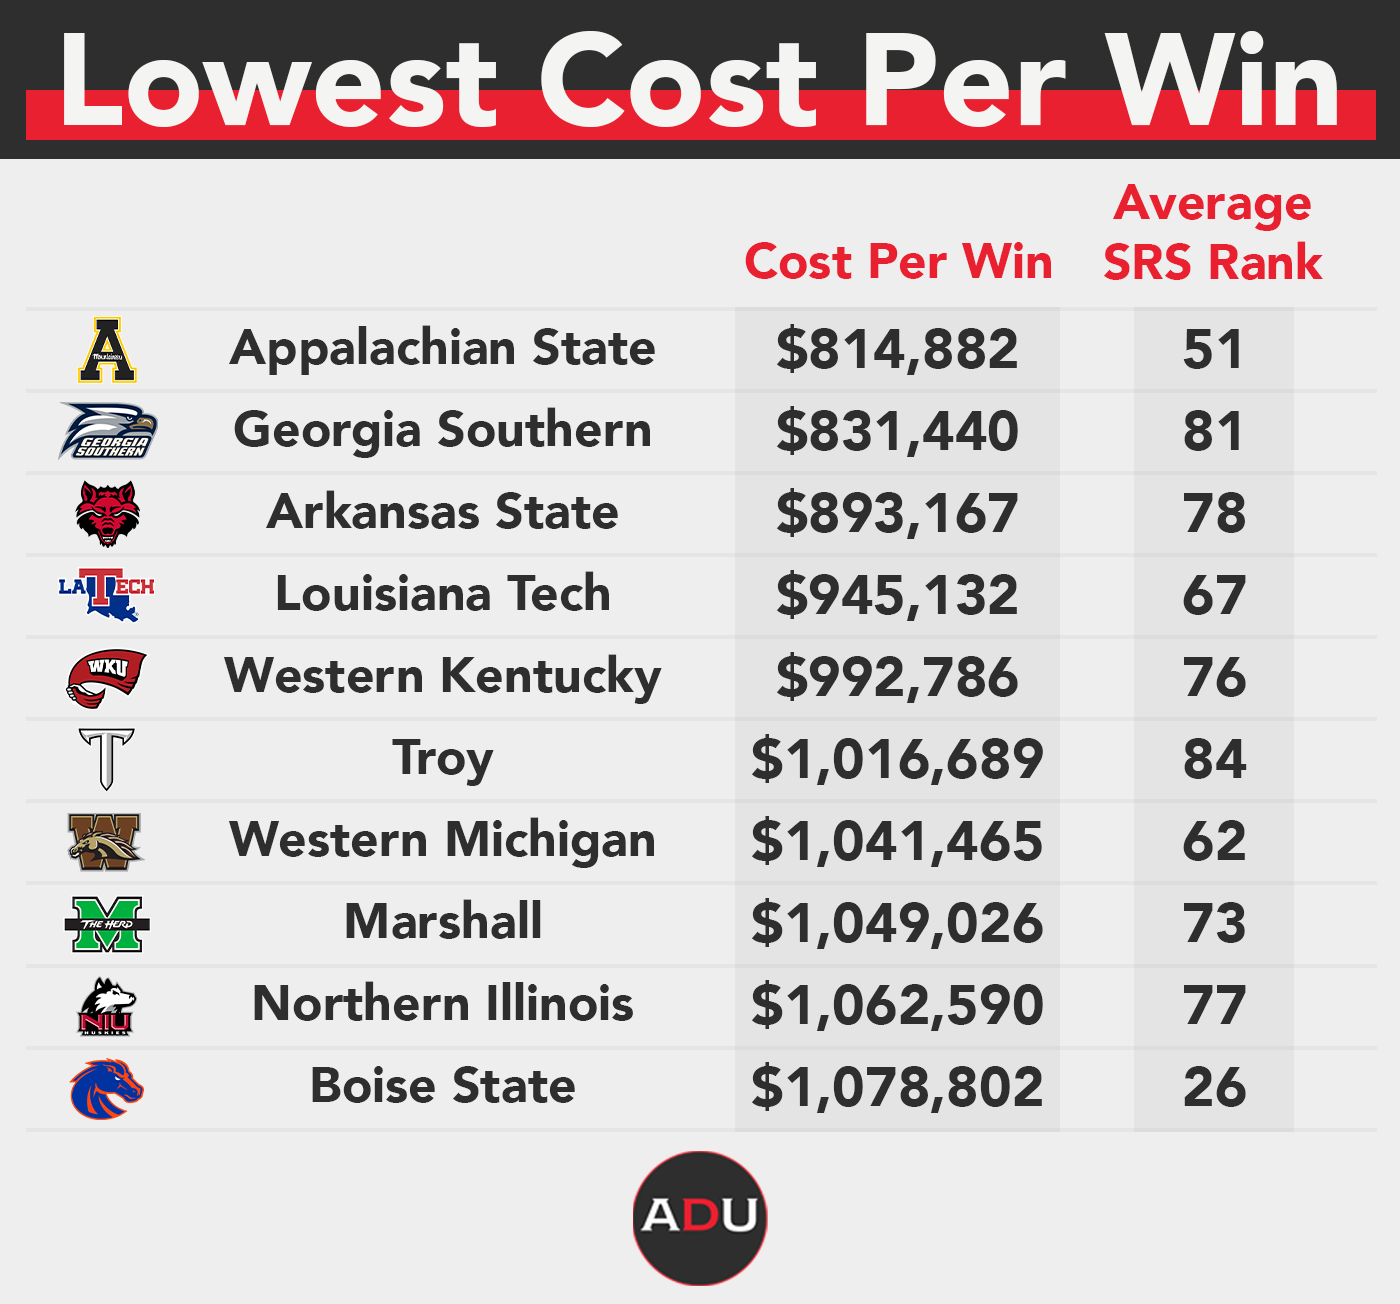
College football’s G5 teams tend to be much more on the thrifty side. Appalachian State has been one of the sport’s great success stories, using its historic 2007 Michigan upset as a springboard to elevate to the FBS level. The Mountaineers have since won at least 10 games in four of their first seven FBS seasons and appeared in the AP poll in each of the last three years. The program has accomplished these feats while still maintaining the lowest cost-per-win average in all of FBS.
From a broader perspective, a larger budget equates to more recruiting flexibility and better facilities, which leads to stronger roster talent, and translates to an improved on-field product. Stronger on-field performance, of course, creates more revenue and allows the budget to increase, continuing the cycle.
Athletic Director University has investigated and statistically proven this cycle to be true. However, the following question should be asked: Does on-field success come first or does financial emphasis trigger the momentum?
Every program is different, though sustained success outside of the Power Five heavyweights likely requires continued leadership retention and years of overachievement from a cost-per-win perspective.
UAB’s football program was discontinued in 2014 and later reinstated prior to the 2017 season. Bill Clark has remained head coach throughout the process and it has paid massive dividends for the Blazers program. Following the reinstatement, Clark led UAB to a bowl game after an 8-win season and followed it up with an 11-win campaign and bowl victory in 2018.
UAB recorded at least eight wins in 2017, 2018 and 2019, a feat that wasn’t accomplished a single time in the program’s previous 19 seasons. With continued local support, fundraising and on-field success, the Blazers are now set to unveil Protective Stadium, a brand-new, 47,000-seat capacity football stadium later this year. Clark has also helped welcome two of the four highest-rated recruits in school history since the program’s revival, per 24/7Sports.
As such, UAB’s football budget has experienced the 14th-largest proportional increase since 2014 and the fourth-largest increase among G5 programs in the last five years.
Most universities won’t undergo the extremes of discontinuing FBS football to winning 11 games in a three-year window. UAB’s case supports the overarching theme of the study, though, which is to find the right leaders who can win on a budget, generate fan engagement and support through on-court/field success, and leverage that newfound interest into improvement, renovations and financial backing for other sports.
Since UAB brought back football, athletic director Mark Ingram has helped the university raise more than $100M in funding, designed and constructed a $22.5M football practice facility, hired former Ole Miss head coach Andy Kennedy as the new men’s basketball coach, and also saw its student-athletes record the highest grade-point average in school history, per UAB’s athletic website.
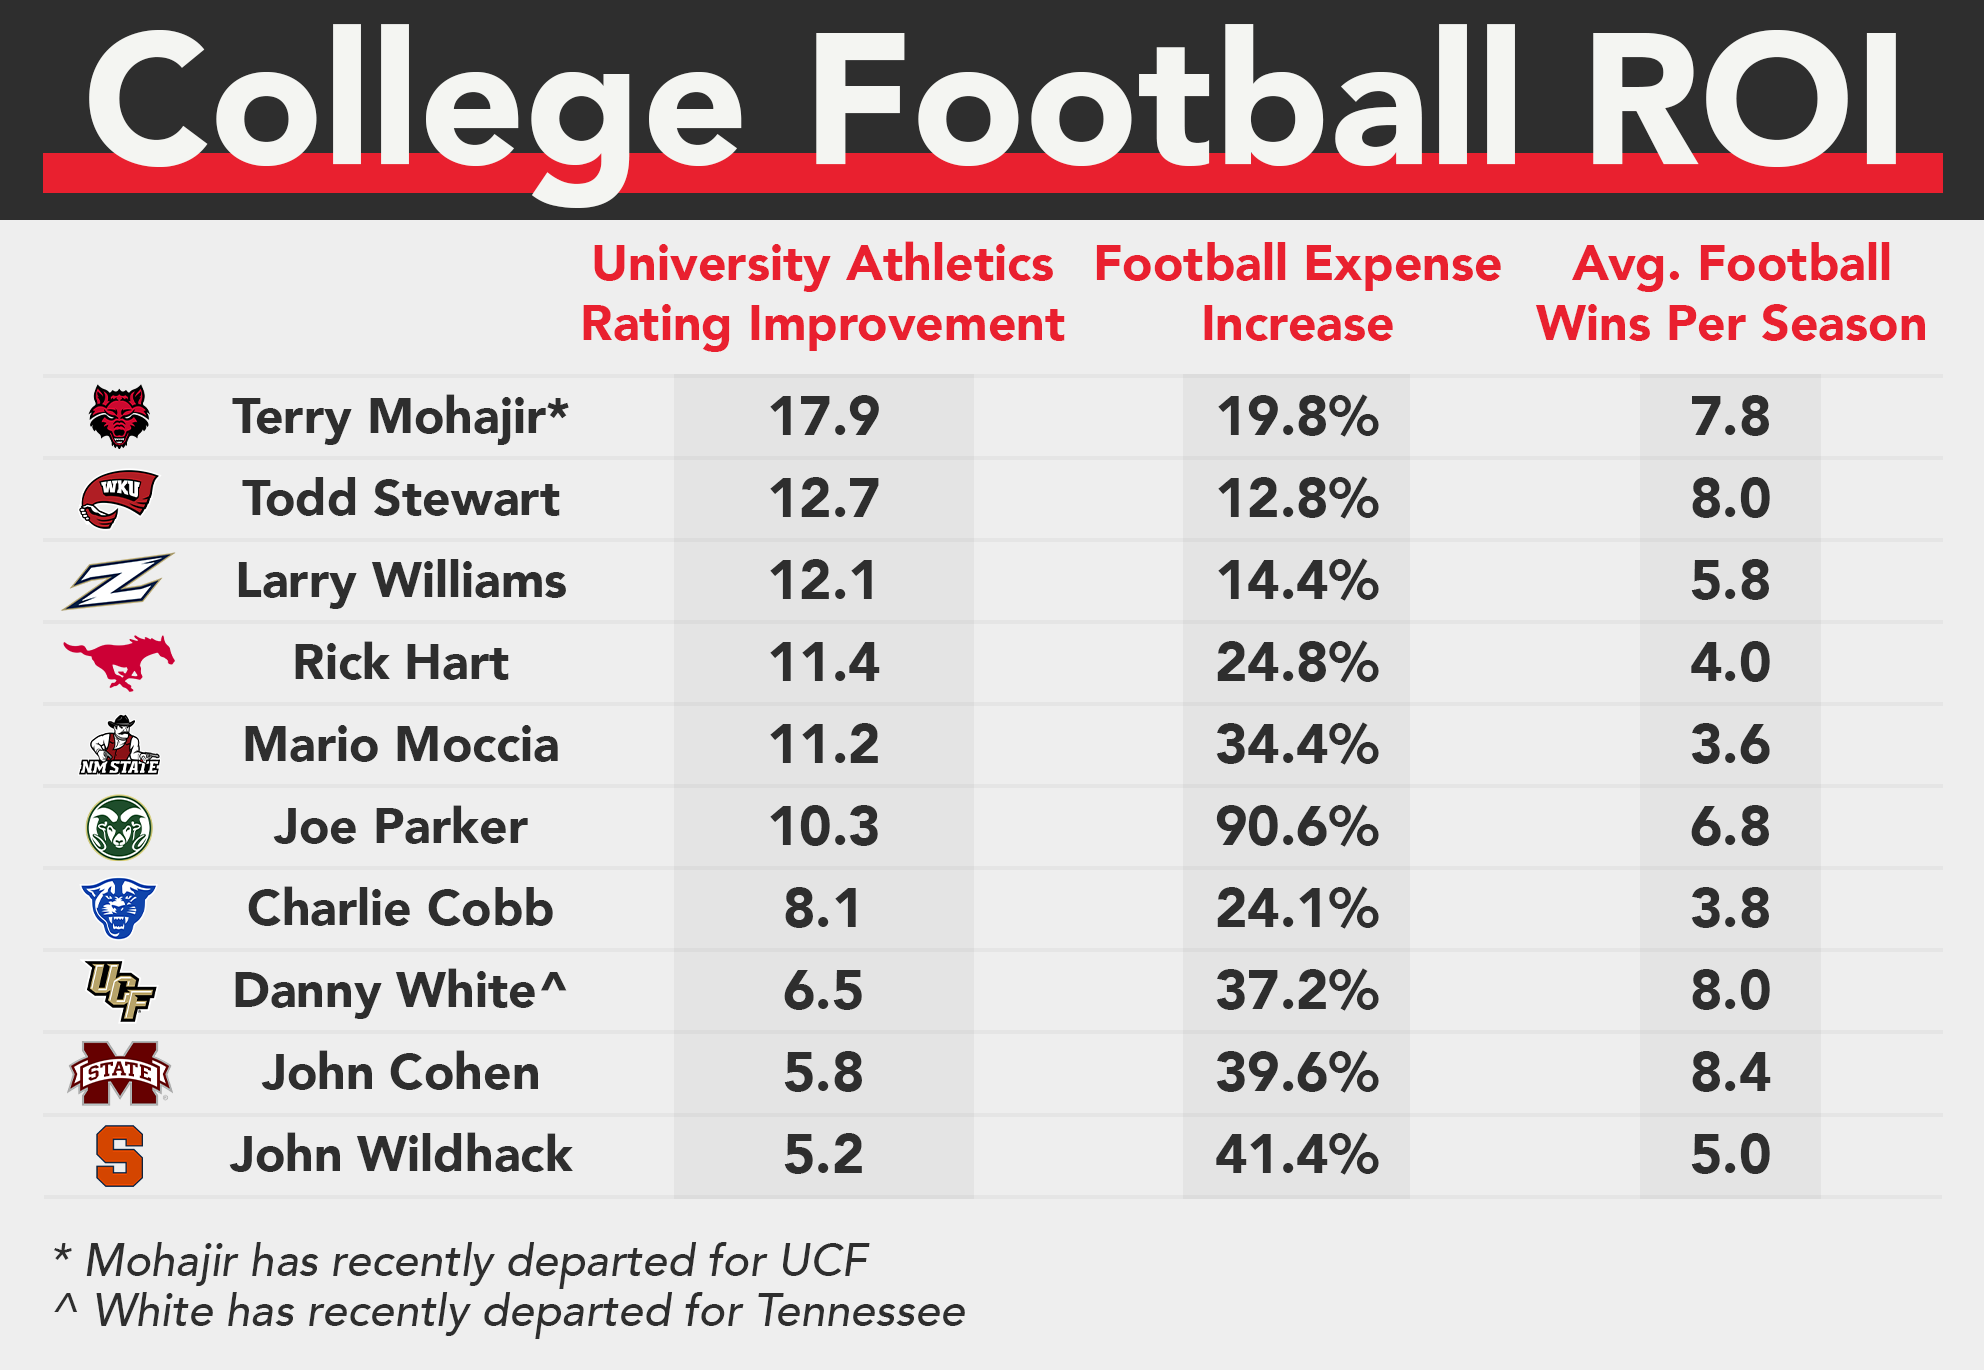
Unsurprisingly, athletic directors who recorded the highest institution-wide improvement in ADU’s recent AD performance study led universities that have shown recent growth and increased investment in football.
College athletics will never have a clear cut formula that every institution should follow for long-term success. After all, even though these coaching staffs set out to win and recruit like everyone else, program goals at Alabama, for example, figure to be far different than the goals set at UAB.
But whether a program is competing for a national championship or its first bowl game in several years, the nation’s firm interest in football means a lot for other sports as well. With average yearly FBS expenses exceeding $20M and approximately 30 percent of all athletic expenses going to football, even a slight uptick in football revenue can go a long way in improving the experiences of the thousands of other student-athletes.