

At the time of this publication, 4,360 men’s basketball student-athletes have transferred to or from a D-I basketball program over the past six seasons, according to Verbal Commits. College basketball’s transfer rate is the second-highest in the NCAA among male sports, where approximately 33% of players transfer at some point in their collegiate career. In short, transfers have become a vitally important aspect of college basketball. Adding players from the transfer market to fill out rosters can sometimes mean the difference between winning a national championship and suffering an early tournament defeat. Losing players via transfer also carries a similar importance.
In order to get a better understanding of how transfers affect college basketball teams, we decided to take a deep dive into the data. Using Verbal Commits’ transfer database (which dates back to 2012), we were able to compile a big picture overview of: players’ transfer destinations, how conferences are impacted as a whole, the average recruiting rankings of the players that transfer, and whether players are transferring to teams that are better or worse than their previous teams.
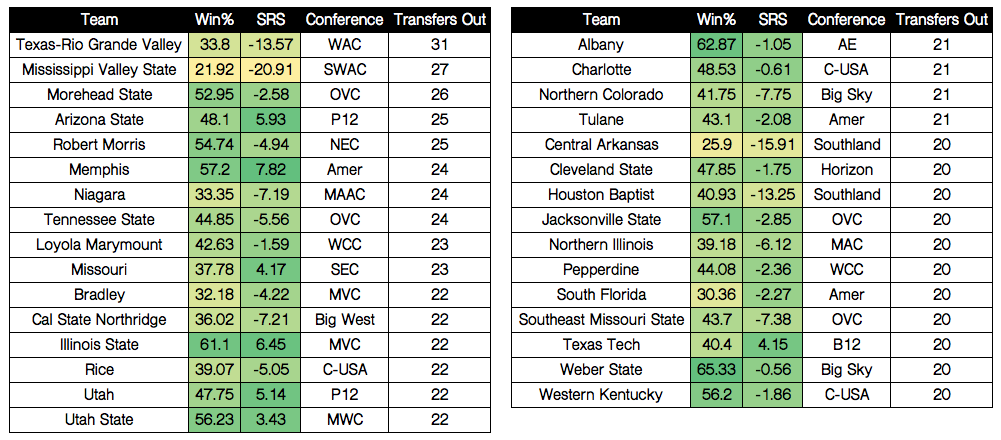
First off, all of the teams that have lost 20 or more players to the transfer market since 2012 are listed below. Power conference teams on the list include Arizona State, Missouri, Utah and Texas Tech. Winning percentage and SRS* are both six-year averages for each team.
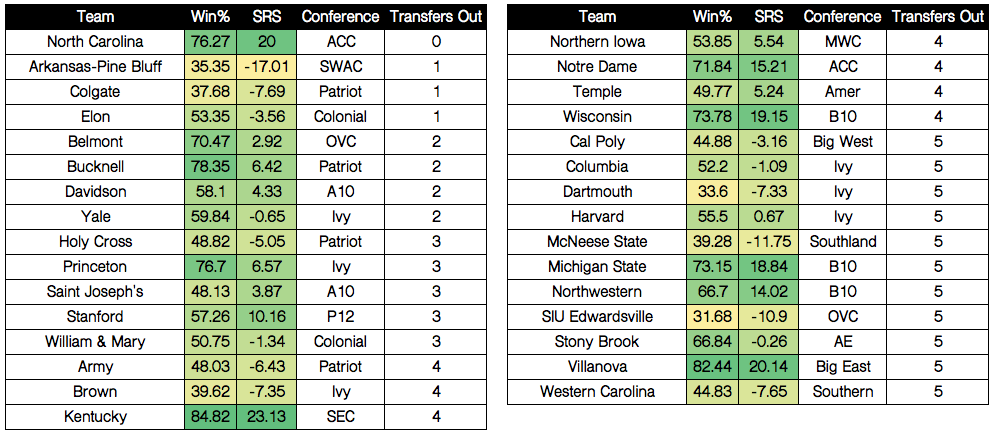
Also, the teams that have had the fewest players transfer from their teams are below, where North Carolina is the only D-I program to have not lost a player via transfer over the past six off-seasons.
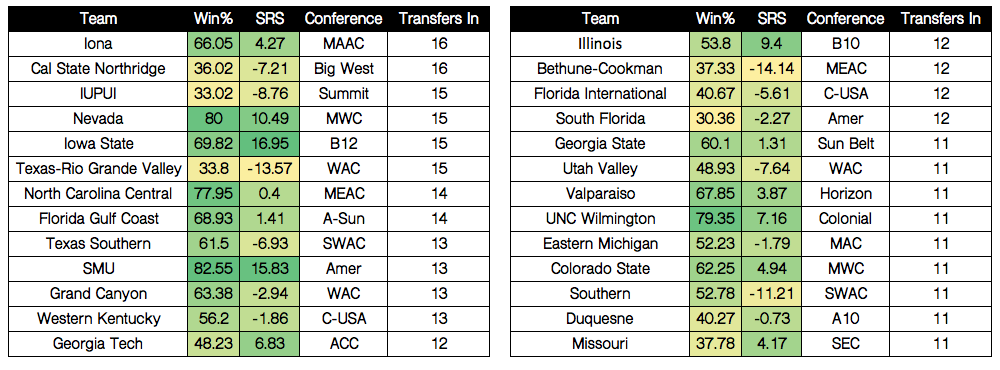
Iona and Cal State Northridge lead the way with incomers, both having added 16 players from the transfer market in the past six years. Five of the 26 teams that have added 11 or more transfers have had an average winning percentage of 40% or worse since the 2011-12 season.
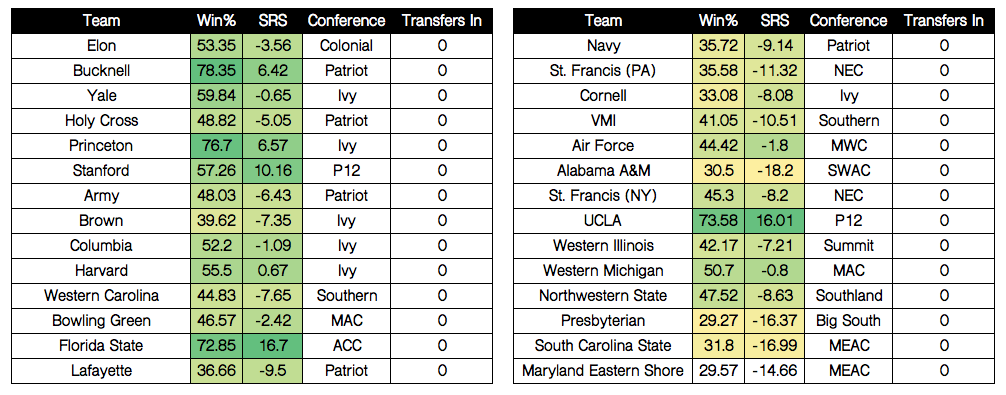
Conversely, 29 of 351 D-I teams have not had a transfer join their team since 2012. Academics seem to have played a part in this list, where Stanford, Army, Navy, and six Ivy League schools are among the 29.
Average recruiting stars is also useful information. We found the average recruiting stars for each incomer and departure by conference since 2012.
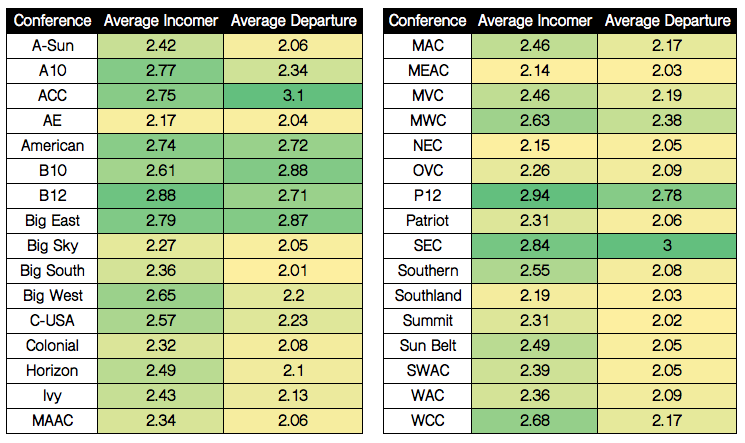
The Pac-12 (2.94), Big 12 (2.88) and SEC (2.84) welcome the highest-rated recruits on average, while both the ACC (3.10) and SEC (3.00) are the only conferences that average three-star recruiting departures.
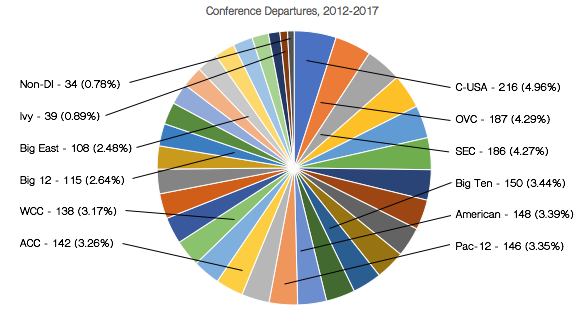
In terms of departures by conference, Conference USA has had 216 players leave the league since 2012. The Ohio Valley is a distant second with 187 players, then comes the laundry list of power conferences. Just 39 players have transferred from the Ivy League, and 34 players have transferred from non-D-I programs to D-I programs.
Also, the incomers…
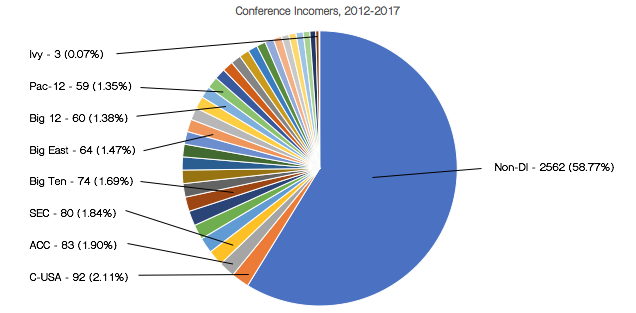
Nearly 60% of transfers, instead of joining other D-I teams, have left D-I basketball completely since the 2012 offseason. Then comes Conference USA, which has added 92 players. The ACC leads all power conference teams with 83 players transferring into the conference over the last six years. Only three players have transferred to Ivy schools.
The idea that college basketball players tend to transfer to better teams is almost entirely a myth. When plotting team’s net players lost and gained via transfer along with each team’s SRS rating over the same period, the R-squared linear correlation was just 0.10765. This means just over 10% of the data can be explained by the linear regression. Or, in simple terms, there is almost no correlation between the amount of players lost or gained via transfer and team strength whatsoever. The same can be said for both players transferring from programs (R-squared of 0.05429) and players transferring to programs (R-squared of 0.02242). This also supports the previous pie chart, which showed that nearly three in five transfers leave D-I basketball entirely.
The table below indicates the transfer’s new team’s winning percentage compared to his previous team’s, and the frequency of the given change over the past six offseasons.
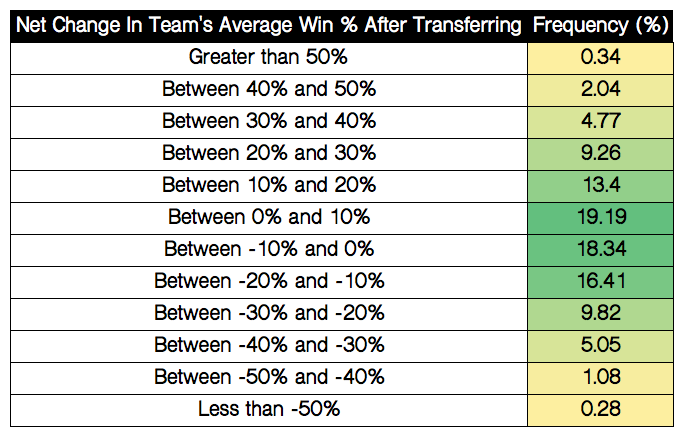
As shown in the table, the majority of transfers are joining teams that typically have a very similar winning percentage. Just 7.15% of transfers go to teams that have an average winning percentage 30% or better than their previous team’s. Interestingly enough, that’s almost equal to the frequency of transfers going to teams that have a winning percentage 30% lower or worse than their original team’s (6.41%). Just over two-thirds of players transferring between D-I teams go to teams that have an average winning percentage between 20% lower and 20% higher than the team they left. Exactly 49% of transfers join teams that have had a higher average winning percentage over the past six seasons. This does not support the idea that players want to transfer to better teams.
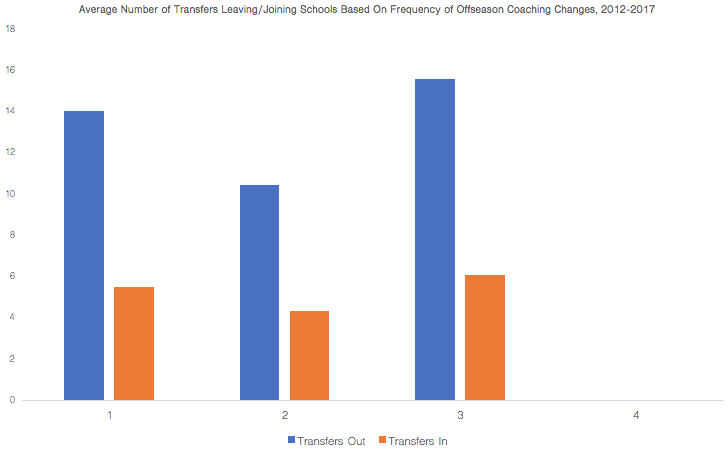
Coaching tenure length also plays a part in college basketball’s transfer movement. Unstable coaching staffs tend to have more players transfer out of their university than programs that have retained the same head coach.
In the past six seasons, teams that have retained the same head coach have averaged 10.4 players transfer out of the university, while teams with two or three coaching changes have averaged 14.0 and 15.5 transfers over the six-year span, respectively.
There is not a strong correlation for players transferring into programs, though. Regardless of zero or three coaching changes, teams average anywhere between four and six players transferring into their respective programs over the six-year span. The number is slightly higher for programs that have had more coaching changes. Presumably, this is due to the teams’ need to fill scholarship spots, because programs that have more coaching changes tend to have more players transfer out of the university.
Over the past six seasons, 25 programs have had more than 20 players transfer out of their respective universities. Of those 25, 22 have had at least one head coaching change. Six of the 25 have had multiple head coaching changes.
Conversely, 31 programs have had five transfers or fewer, and only nine of the 31 programs have had a coaching change over that same period. None of those programs have had multiple head coaching changes.
Though many have speculated that there is a legitimate connection between transfers and its effects on recruiting, our studies do not confirm this to be true.
The following tables show the ten power conference teams that have lost the most players via transfers (left) and added the most players via transfers (right) over the past six seasons. Then, I compared the program’s change in national recruiting class percentile over that six-year period (2012-2017) and the previous six seasons (2006-2011) to determine whether there was a correlation between transfers gained/lost and quality of recruiting classes. Recruiting data is from 24/7 Sports.
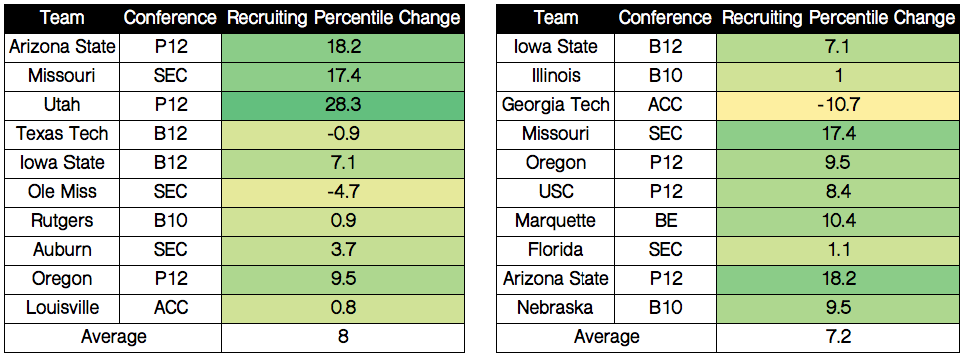
What was found is that the teams that have lost the most transfers, on average, have seen a slightly larger improvement in recruiting class percentile over the six-year period than the teams that have added the most transfers. This could be partially due to teams adding quality recruits and then seeing players transfer out of the university because of expected loss of playing time or visibility. Other potential causes could included changes in a program’s coaching staff, conference realignment, or NCAA sanctions or penalties. Only two of the ten programs that have lost the most transfers since 2012 have had a decline over national recruiting rankings.
Transfer destinations and proximity to a given player’s hometown can also play a part in the transfer market.
In total, of 2017 D-I transfers from either United States or Canada, 168 players transferred closer to their hometown, while 145 players transferred further away from their hometown. Of those same 333 players, the average player attended a university 746.6 miles from their hometown and transferred to a university that was 643.5 miles from their hometown – a difference of over 100 miles.
The following table indicates the frequency of players attending universities a specified distance from their hometown, and the average distance from their hometown to their new team.
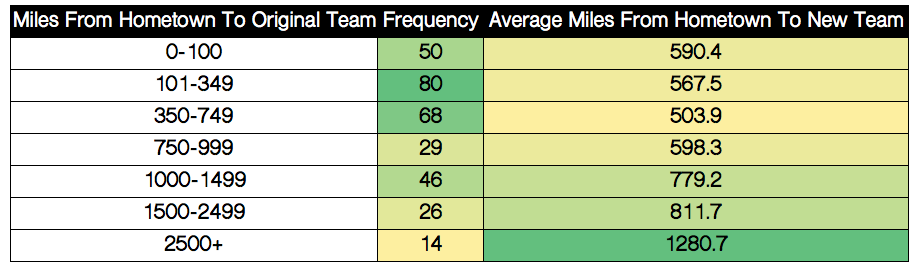
Nearly three in four players (72.5%) originally attend a university that is within 1,000 miles of the player’s hometown. That number rises to 76.7% after the player has transferred, where 240 of the 313 players this offseason transferred to programs that were within 1,000 miles of their hometown.
Players that first attended a university close to home tend to transfer to programs that are much further across the country. A total of 26 players originally attended a school within 30 miles of their hometown, but just three of those 26 transferred to a university within 100 miles of their hometown. Five of the 26 transferred to a university over 1,000 miles away from home.
From the 2017 transfer class, three players transferred to the university located in their hometown. Fourteen transferred to a university that is within 10 miles of their hometown.
According to Verbal Commits’ composite recruiting ranking, players that were rated as a three-star recruit or higher transferred to a university 577.5 miles away from their hometown, on average. Transfers that were rated lower than a three-star recruit transferred to a university 704.9 miles away from their hometown, on average. The difference of over 125 miles could indicate the willingness of programs to welcome higher-rated recruits. Players that were rated as three-star recruits or higher seem to have more flexibility in transfer destinations than lesser-known, lower-rated players.
Transfers have become a vital part of today’s generation of college basketball. Understanding trends such as which players are transferring, where they are headed, and how it affects programs in the future can have a significant impact on any and all college basketball programs.
All data used in this article are courtesy of Sports-Reference, 24/7 Sports, Verbal Commits, and Google Maps.
*Simple Ratings System: A team rating that takes into account average point differential and strength of schedule.