
Success in college basketball is heavily driven by fan support, most notably in the form of home-court advantage. This season, home teams won 61.0% of conference games, which was the highest mark since 2013, according to college basketball statistician Ken Pomeroy. Home attendance numbers not only have an impact on winning and losing games, but also producing revenue that can elevate programs nationwide.
Because of the massive variations in arena sizes across college basketball, calculating a percentage of total seats filled to gauge fan interest is more intuitive. Filling 10,000 seats at Wichita State’s Charles Koch Arena (capacity of 10,506) would be a strong attendance average, but at North Carolina State’s PNC Arena (capacity of 19,700), 10,000 attendees would mean the arena is about half empty.
To alleviate this issue, we chose to divide home attendance numbers by arena seating capacity to find the percentage of total seats filled by fans. This is a better indication of fan interest than attendance totals and averages.
To begin, the Big Ten has consistently dominated in terms of attendance numbers in recent years. Each of the past eight seasons, the Big Ten has led all D-I conferences in percentage of seats filled.
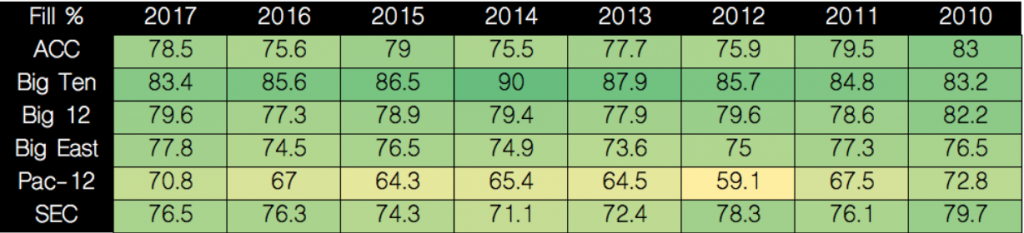
In 2014, the Big Ten sent six teams to the NCAA Tournament. The top three teams in the conference, Michigan, Wisconsin and Michigan State, were all top four seeds in the NCAA Tournament bracket. The result was the Big Ten filling 90% of its arenas during the season, the highest mark of any conference over the past eight seasons.
The lowest average among power conferences was the Pac-12 in 2012, where only 59.1% of the arena’s seats were occupied by fans. The national average over the past eight years of percentage of seats filled for all D-I conferences was 51.6%. The average is 76.8% for power conferences and 45.6% for non-power conferences.
As for average capacities of power conference arenas, the Big Ten leads by a slim margin. The average Big Ten arena capacity is 14,916 seats, with the SEC close behind at 14,624 seats. Rounding out the power conferences is the Big East at 13,711, ACC at 13,655, Big 12 at 13,337, and Pac-12 at 11,609. The Mountain West, which is largely considered a mid-major conference, actually has a higher arena capacity than the Pac-12 at 12,355 seats, but the Mountain West filled 63.2% of its seats between 2010 to 2017 while the Pac-12 filled 66.4%.
Since 2010, the WCC has seen the largest increase in average arena capacity. Adding BYU into the fold, which plays in the 18,987-seat Marriott Center, was the major notable change to the WCC’s list of arenas. The WCC’s percentage of seats filled has been mostly unchanged, though, as its average has ranked anywhere between No. 8 and No. 11 among D-I conferences in percentage of seats filled.
To some surprise, head coaching changes aren’t closely correlated to increasing or decreasing attendance numbers, according to our research. In fact, only one major program highlighted in our research showed a strong positive correlation between winning percentage and percentage of filled seats in the five years after the end of a specified coaching tenure.
Tom Crean departed Marquette for Indiana in 2008 after recording the third-most tenure wins in program history, but the Golden Eagles saw modest increases in winning percentage and attendance in the five years following the Crean era. Marquette’s five-year winning percentage average increased by 3.6%, and the percentage of seats filled in Bradley Center improved by 5.0%.
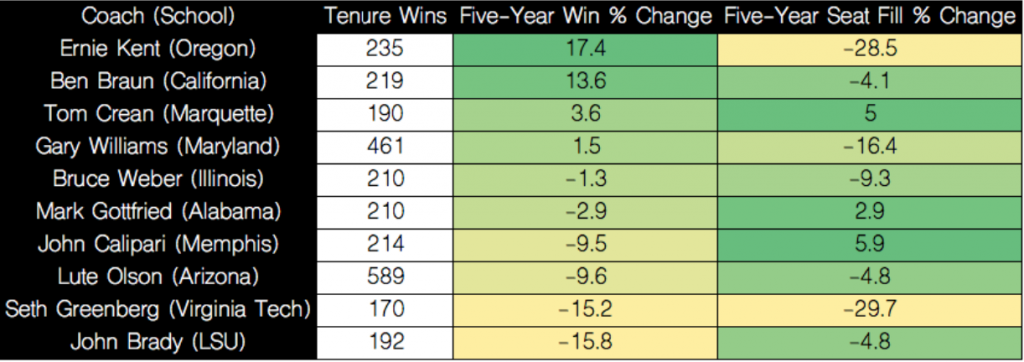
Other programs were not nearly as fortunate. Ernie Kent wrapped up his Oregon tenure in 2010 while the program was amidst a transition into the new Matthew Knight Arena, which is more than 3,000 seats larger than its previous home, McArthur Court. The Ducks quickly rose to a prominent Pac-12 competitor under Dana Altman, Kent’s successor, but it has taken years for Oregon’s attendance numbers to resurface. Since moving to Matthew Knight Arena, Oregon’s percentage of seats filled has only surpassed 65.0% one time, which was during Oregon’s run to the Final Four last year.
The most peculiar case is Memphis, which has nosedived on the basketball court since John Calipari left to take the Kentucky job. Strangely enough, Memphis’ attendance numbers in the five years following Calipari were actually stronger than in the final five years under Calipari. Memphis’ five-year winning percentage average dipped nearly 10.0%, but the percentage of seats filled in FedEx Forum grew 5.9%, the best figure among the highlighted coaching transitions.
The ten coaches included in our data are the winningest high-major coaches that are at least five years removed from their job. This allowed us to discern whether the coaching change had an impact on fan support, and in large part, despite the prominence of these coaches, there was very little to suggest that a change in head coaches impacted attendance to any degree.
Recruiting has been proven to have a substantial impact on team attendance, though. Since 2011, 63.6% of programs that had a 24/7 Sports top 15 recruit saw an increase in its seats filled percentage the following year.
In 2015, Maryland filled approximately 70.7% of 17,950-seat Xfinity Center. The Terps then added recruit Diamond Stone, a consensus five-star star who ranked sixth in 24/7 Sports’ class of 2015 rankings. Thanks to Stone and a strong returning roster, Maryland nearly sold out the Xfinity Center in 2016, averaging 17,863 fans per night in the 17,950-seat arena. The top ten year-to-year increases in percentage of seats filled after adding a top 15 recruit are below.
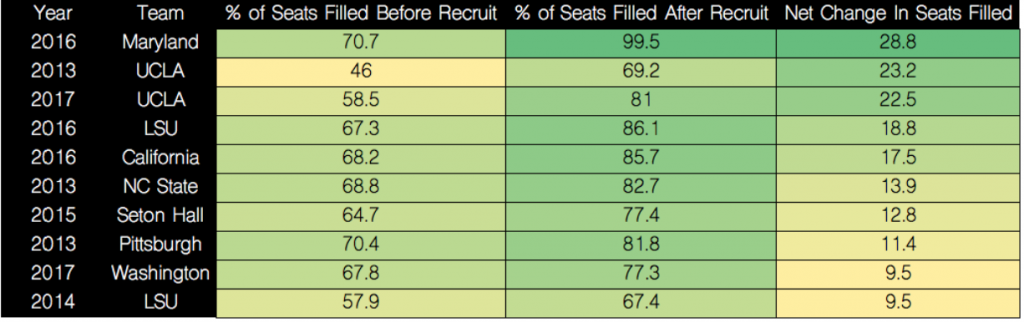
Of the ten most significant increases, the Pac-12 leads the way with four teams (2013 UCLA, 2016 California, 2017 Washington and 2017 UCLA). Among those four teams are household names like Lonzo Ball, Markelle Fultz, Jaylen Brown, Ivan Rabb, and Shabazz Muhammad. Uncommon recruiting powers North Carolina State and Seton Hall also appear on the list after having added stars Rodney Purvis and Isaiah Whitehead, respectively.
A conference’s team membership, of course, plays a major factor in attendance numbers as well. The table below highlights the net change in percentage of seats filled by notable conferences since 2010.
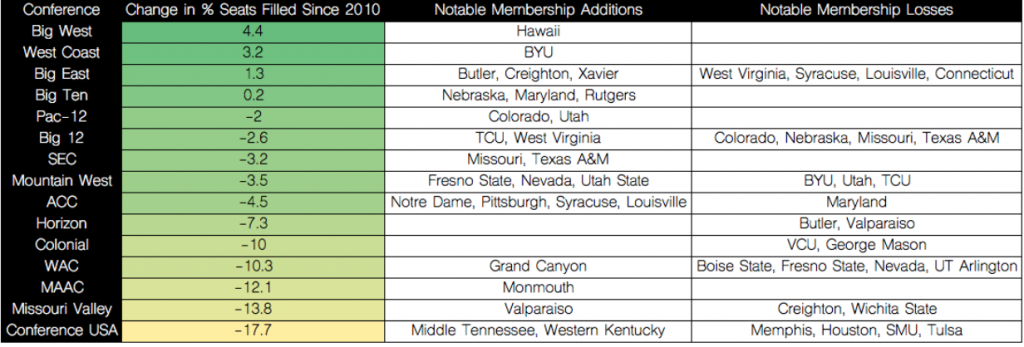
The Big West has seen the biggest leap in percentage of seats filled since 2010, a 4.4% increase, followed by the West Coast Conference (3.2%), Big East (1.3%) and Big Ten (0.2%). Each of these conferences have added at least one program that has won one or multiple games in the NCAA Tournament in the past seven seasons. Many considered the Big East to ride off into the sunset after losing its bluebloods of West Virginia, Syracuse, Louisville and others, but the league bounced back nicely by adding programs that had success at the mid-major level. Butler, Creighton, and Xavier all departed to the Big East from mid-major conferences, and have enjoyed tremendous success upon their arrival.
As far as the declining conferences go, there are five leagues that have seen double-digit decreases in percentage of seats filled since 2010. Conference USA filled 62.9% of its seats in 2010, but that average has steadily dwindled to just 45.2% this past season. In addition to Conference USA, the Missouri Valley (minus-13.8%), WAC (minus-10.3%), and Colonial (minus-10.0%) have been gutted by teams upping and leaving their conferences for new opportunities. Ex-Conference USA members Memphis, Houston, SMU and Tulsa are all currently in the newly formed American Athletic Conference along with Wichita State, which is formerly of the Missouri Valley. The WAC was sent into a tailspin after Boise State, Fresno State and Nevada joined the Mountain West, and the Colonial is having challenges to return to national legitimacy, losing VCU in 2012.
Our research indicates a bit of a background behind rising (and falling) attendance numbers across Division-I college basketball. As found in our data, arena size, recruiting, and conference membership can lead to significant changes in team and conference attendance numbers, which ultimately has an impact on the health of programs and conferences.