
For the better part of the past three-and-a-half years, I have tracked sports sponsorship among four-year colleges, paying particular attention to trends in sports added and dropped. My observations started in March 2020 when the pandemic began. And while this has proven to be insightful, one question has dogged me. How do my observations during this period compare to what normal sport sponsorship changes occur in a non-pandemic time period? In other words, are the trends in my data a result of the pandemic, or is this simply business as normal for college athletic departments?
In an attempt to answer that question, I consulted the NCAA’s own data regarding sports sponsorship trends over the past 20 years, 2002-03 to 2021-22, and cross-referenced with data regarding membership in each NCAA division retrieved from the Department of Education’s EADA site. What follows are my observations of that data, independent of contextual factors such as broader economic conditions.
The only year in the sample in which the overall number of sports sponsored across all NCAA institutions decreased was 2020-21, the pandemic year. Overall sport sponsorship fell 1.3% (n = 258) that year. This observation illustrates the direct impact the pandemic had on universities. Seven NCAA institutions closed within the first 12 months of the pandemic’s beginning, shuttering 94 athletic teams.
However, the overall number of sports sponsored rebounded in 2021-22, increasing by n = 177, with one notable and pronounced exception. Division I institutions sponsored 22 fewer sports in 2021-22 than in 2020-21. In total, according to the NCAA’s data, since the 2019-20 academic year, the heavily resourced Division I schools decreased the number of sports they sponsored by 82, despite increasing the overall number of Division I schools by two, from 350 to 352.
Enrollment-driven institutions in Division II and Division III, meanwhile, added 199 sports between 2020-21 and 2021-22. Division III schools grew by 119 sports in 2021-22, the second highest year-to-year increase observed in the sample. The importance of sports to institutions dependent upon tuition revenue could not be more clear. However, as the graph below depicting 20 years’ worth of data suggests, Division I institutions do not appear to be interested in creating more sport opportunities for student-athletes.
Graph Showing Number of Sports by Division (2002-03 to 2021-22)

Throughout the previous decade, from 2010 to 2019, Division III institutions added an average of 75.5 programs per year, with a high year-to-year total of 142 between 2017-18 and 2018-19. The 8,436 sports sponsored by Division III schools in 2021-22 is 10 more than 2019-20, despite the presence of 11 fewer institutions. In 2002-03, the first year of my data set, the 379 Division III schools sponsored an average of 18.56 sports. In 2021-22, the 410 Division III schools sponsored an average of 20.58 sports.
Conclusion? Division III has always valued the student-athlete experience far more than other divisions by offering increased participation opportunities and embracing a campus culture in which, in many instances, more than half of the student body participates in a sport. This finding is consistent with the 2018 work of James Hearn, Welch Suggs, and Jennifer May-Triletti of the University of Georgia, who prepared a report for the Council of Independent Colleges on the role of athletics on CIC campuses, many of which compete at the Division III level. They concluded, “The level of student participation in intercollegiate athletics in CIC institutions has grown appreciably over recent decades.”
While the pandemic temporarily slowed growth of sports sponsorship in Division III, the growth mindset is back on track.
The story is wildly different in Division I where the overall number of sports sponsored in 2021-22 (n = 6,682) has regressed to 2016-17 levels (n = 6,669), despite six more schools. According to EADA data, there were 352 Division I institutions in 2021-22, up from 325 in 2002-03 (according to EADA data). Those 325 schools in 2003 sponsored 6,242 sports, an average of 19.21 per institution. In 2021-22, the 352 (according to EADA data) Division I schools supported 6,682 sports, an average of 18.98 per institution.
While Division III institutions have added an average of 2.02 sports per school in the past 20 years, the resource-rich Division I institutions have subtracted an average of 0.23 sports per school in the same time period.
Conclusion? Despite more resources in Division I, the overall average number of sports sponsored per school has declined. How can we believe Division I athletic directors are sincere when they talk of creating a positive experience for student-athletes while simultaneously not growing opportunities for athletes? Division I administrators appear to emphasize the revenue-producing benefits of athletics and tolerate the presence of non-revenue sports because they are required to.
Division II data presents a more muddy picture. Since sponsoring 5,006 total sports in 2016-17, the number in Division II has declined in three of the past five years, resting at 4,987 in 2021-22. At the same time, the number of Division II institutions decreased by 12, suggesting the pandemic had no impact on Division II universities’ decisions to cut sports. In fact, since the number of sponsored sports rose by 80 in 2021-22, it is possible Division II institutions made a conscious decision to add sports following the pandemic, perhaps in an attempt to combat declining enrollment.
Looking at gender differences provides additional insight into these trends. The number of sports sponsored for Division I women rose each year in the past 20 years except 2020-21 (down n = 23) and 2021-22 (down n = 1). On the Division I men’s side, the number of sports sponsored in 2021-22 (n = 2,987) was just 37 sports greater than in 2002-03, despite 27 more institutions. By comparison, there are 403 more women’s sports in the same time period.
That trend holds for the other divisions as well. Division II is up n = 718 women’s sports and Division III is up n = 719 women’s sports in the same period. Viewed another way, of the 3,020 total NCAA sports added in the past 20 years, 1,840 (60.9%) are women’s sports. Fifty years after Title IX, women’s intercollegiate sports are, indeed, finally having their moment.
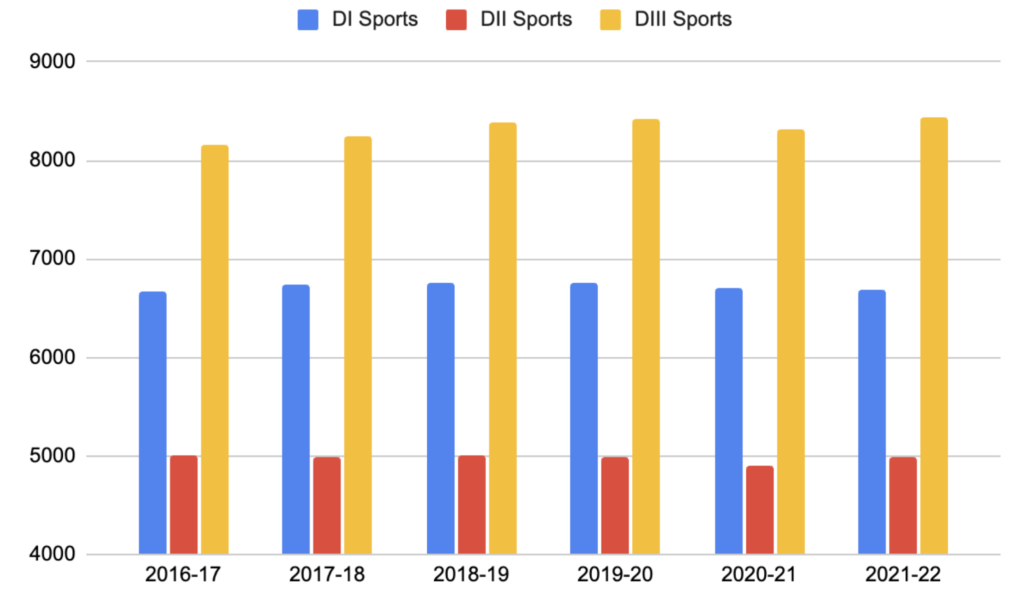
Back to my original question as to whether the changing nature of sports sponsorship since March 2020 is a reflection of the pandemic, or whether it is just business as usual. Using Fall 2016 as an arbitrary starting point, Division I schools are up 13 total sports (6,669 to 6,682) with Division II down 19 total sports (5,006 to 4,987). Division III is up an astonishing 270 sports (8,166 to 8,436) while the other two divisions combined are down a collective 6 sports.
Graph Showing Number of Sports by Division (2016-17 to 2021-22)
It is evident that Division III institutions view sports sponsorship as both an essential tool to maintaining or increasing enrollment and as part of their individual missions. However, that bubble may be ready to burst as Division III schools appear to be pulling back on adding sports.
In August 2022, Division III schools announced 17 new sports and followed that with an additional 11 in September 2022. The trend line in 2023 looks much different with only nine new sports announced in August 2023 and zero announced in September 2023.
While adding sports certainly has the potential to boost enrollment, it does create operational challenges with additional needs for practice facilities and locker room space. Athletic departments concerned with creating a positive student-athlete experience might be reconsidering how to foster that environment when athletes need to store gear in their dorm rooms or schedule lifts at odd times in order to not miss class. More sports equals more costs.
I wrote last week about Division II Kentucky Wesleyan College’s decision to drop eight sports on my Substack newsletter, Glory Days. In that article I focused on the idea that declining campus enrollment (despite last week’s NSC report) contributed to the need to cut sports. I drew this conclusion because the athletic director said as much in the school’s news release. I posed the hypothetical question, would KWC have cut these sports if they were self-sufficient, meaning they did not need the support of other tuition-paying students to cover expenses?
It is an interesting question and one which is worth pursuing. Are universities moving toward viewing individual sport programs as profit centers? And, if this does become a trend, have we reached peak sport sponsorship?