AthleticDirectorU has teamed with Spencer Fane to provide unprecedented insight into coaching contracts and salaries. Tonight is the second in a series aimed to provide context and clarity.
We reviewed all forms of compensation of the head women’s basketball coaches at National Collegiate Athletic Association member institutions of the Atlantic Coast, Big Ten, Big 12, Pac-12 and Southeastern Conferences (the, “Autonomy 5”). We analyzed these employment agreements and related documents, which were obtained in partnership with USAToday, and created a sortable database of primary compensation components (Click here to view the database). In conjunction with this analysis we researched and considered applicable biographical and performance data for this group of coaches as well as corresponding compensation components of their head men’s basketball coach counterparts. From this aggregate analysis, we respectfully submit:
Ten Economic, Competitive and Comparative[1] Takeaways.
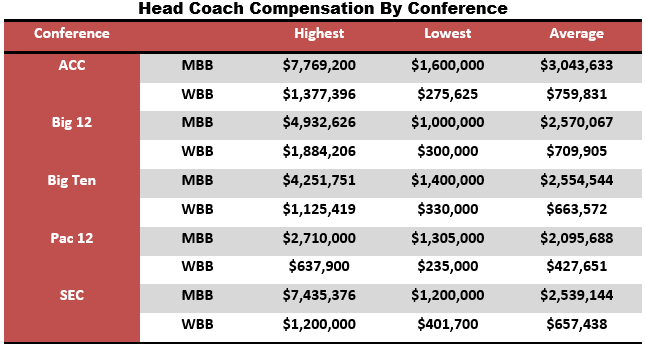
- Head Coach Compensation By Conference
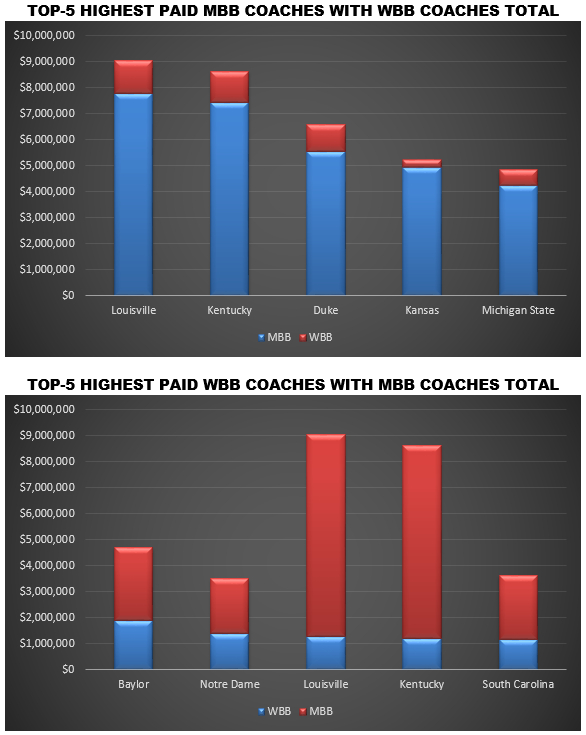
- Top 5 Highest Men’s and Women’s Compensation & Highest Combined Compensation
- 35 schools pay their head football coach more than the head coaches of its men’s and women’s basketball teams combined

The foregoing chart evidences the monetary difference between the aggregate annual guaranteed compensation paid to a university’s men’s and women’s basketball coaches relative to the compensation paid to its football coach. On aggregate average, the total annual guaranteed compensation for the MBB and WBB head coaches of the Autonomy 5’s is $312,754 less than the total annual guaranteed compensation for the head football coach in that group.
- Path to An Autonomy 5 Head Coaching Position
Of the 2017-2016 head MBB coaches, 60[2] of the 65 (92.31%) were college head coaches in their previous positions (notable exceptions include Jim Boheim and Tom Izzo). Yet, 19 of the 65 (29.23%) 2016-2017 head WBB coaches were not college head coaches in their previous positions, including Sherri Coale, Kim Mulkey and Vic Schaefer.
- The average tenure of 2016-2017 head coaches, at their current institution, was:
MBB Head Coaches: 7.2 seasons
WBB Head Coaches: 9 seasons
The women’s basketball coach has a longer tenure than the men’s basketball coach at 40 of the 65 (62%) Autonomy 5 institutions.
- The average term of contracts reviewed was 6 seasons for men’s and women’s head coach cohorts.[3]
- Bonus Maximum as a Percentage of Total Potential Compensation
Not Surprisingly, NCAA men’s head basketball coaches receive more compensation on average than women’s head basketball coaches. Their contracts also provide a larger portion of annual guaranteed compensation. Consequently, head men’s basketball coaches often have much higher guaranteed annual salaries and relatively lower bonus potential, while head women’s basketball coaches have lower guaranteed annual salaries and relatively more bonus potential.
The chart below shows the total possible bonus compensation for men’s and women’s head coaches as a percentage of their annual university compensation. The five coaches identified for men’s and women’s basketball have the highest possible bonuses in comparison to their annual university compensation.
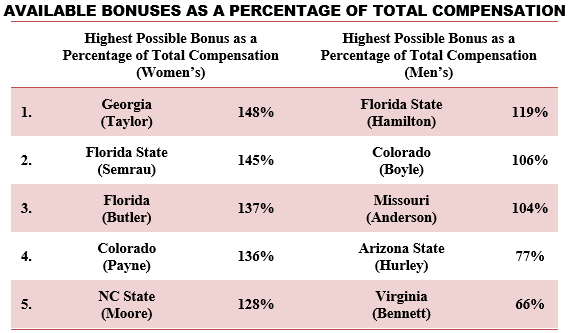
Because a smaller portion of their compensation is guaranteed, women’s head coaches must sustain yearly success in order to maximize their contracts’ value. It follows, then, that collegiate women’s coaches who earn the most money are often doing so because of their current performance, while men’s coaches benefit more from their history of performance.
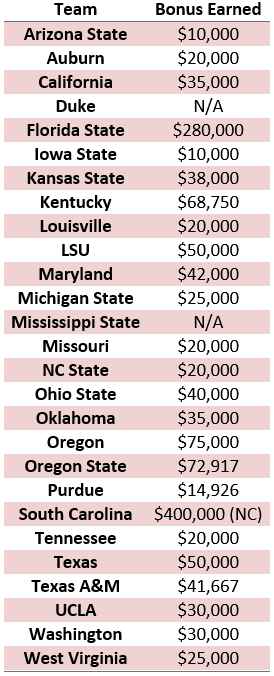
- Bonus Compensation for 2017 WBB NCAA Tournament Teams
The following is a list of universities that appeared in the 2017 women’s NCAA Tournament and the corresponding bonus payments earned by their coaches for the team’s tournament performance:
- Academic Bonus Comparison
Many head coaches in Division I college basketball are awarded bonuses if their team achieves a certain Academic Progress Rate (APR) score. Men’s basketball coaches typically receive much larger bonuses for similar or lower APR scores, although a few universities (e.g., Virginia Tech) establish roughly equivalent APR bonus criteria and bonus compensation. Below are some examples:
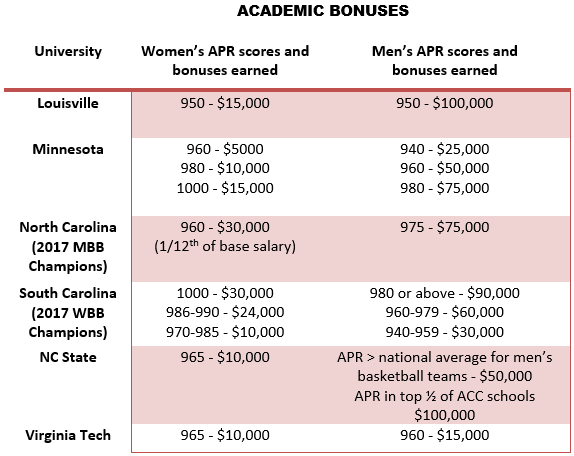
According to the NCAA, the national average APR score for women’s basketball teams is 980[4], while the national average score for men’s basketball teams is 966[5]. The economic justification for tying bonus compensation to increased revenue generated by achieving a certain performance threshold (e.g. attendance or season ticket sales bonuses) is apparent and, in such circumstances, it may be reasonable to award greater bonuses to the coaches of men’s teams if the achievement of a given performance criteria nets greater revenue. The economic justification for materially different academic bonus criteria and compensation is not always apparent.
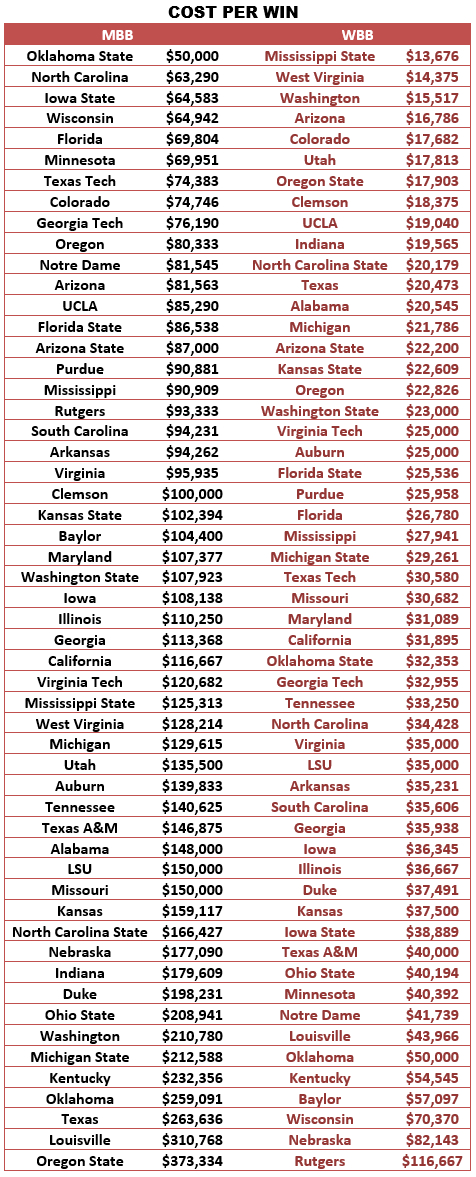
- Overall Winning Percentage / Compensation.
[1] For purposes of comparison, compensation for coaches at private institutions was included only in the circumstances where compensation information was available for both the women’s and men’s basketball coaches.
[2] Includes Matt Painter, who served as coach-in-waiting for one season between head coach positions at Southern Illinois and Purdue.
[3] For purposes of determining the duration of a contract’s Term, we considered the number of basketball playing seasons covered by the contract or the most recent amendment which modified the contract’s Term.
[4] http://www.ncaa.org/sites/default/files/May2017APR_public-release-pres_20170509.pdf
[5] http://www.ncaa.org/sites/default/files/May2017APR_public-release-pres_20170509.pdf

