Regarded as “the crowning achievement in college athletics,” the Learfield IMG College Directors’ Cup came into existence in 1993 to evaluate and honor athletic programs across the country for success in men’s and women’s sports.
The Directors’ Cup combines results from various men’s and women’s sports and generates an overall point total for each competing institution, which is then converted into a national ranking.
Because of its all-inclusive evaluation of an entire institution’s athletics, the Directors’ Cup can act as a baseline evaluation of athletic director performance.
Ratings Methodology
With that in mind, AthleticDirectorU has created a ratings system to assess athletic director performance, largely based on Directors’ Cup results from 2005 to 2019.
The ratings system, which I will be using to assess institutions and athletic directors for the remainder of this study, combines national ranking, conference ranking and total Directors’ Cup appearances into one metric which scales from 0 to 100.
As a guide, institutions can be roughly assigned into the following tiers:
- Tier 1 (90-100) — Nation’s top 20 institutions
- Tier 2 (70-90) — High-level power conference institutions and elite non-power conference institutions
- Tier 3 (50-70) — Mid-level power conference institutions and mid/high-level non-power conference institutions
- Tier 4 (40-50) — Low-level power conference institutions and mid/low-level non-power conference institutions
- Tier 5 (39 or lower) — Low-level non-power conference institutions
To combat the issue of inflated power conference institution ratings typically due to FBS football membership — which would significantly hinder successful institutions such as Princeton, Denver and Villanova — this ratings methodology assigns separate weights to conference ranking and national ranking. Under a unweighted system, a power-conference institution that consistently finishes last in its respective conference would still typically finish ahead of a non-power conference institution that consistently finishes first in its respective conference. Additionally, institutions that have changed conference membership since 2010 are assessed based on how the institution would have fared under its current conference membership based on Directors’ Cup data.
The methodology aims to balance national ranking and conference ranking success without unfairly changing a team’s overall assessment. After a series of trial-and-error tests, the most appropriate conclusion was to give a slightly heavier weight to national ranking for the final weighted formula. As such, power-conference universities, on average, tend to be rated higher but highly successful non-power conference universities are appropriately awarded for their accomplishments. Ultimately, this formula aligned best with both Directors Cup rankings while still promoting non-power conference success.
Here are the top 10 conferences based on average rating: Big Ten (76.6); ACC (75.7); Big XII (75.3); SEC (75.1); Pac-12 (74.5); Ivy League (70.9); Mountain West (65.8); American (65.5); WCC (63.1); Big East (63.0).
Performance Ratings
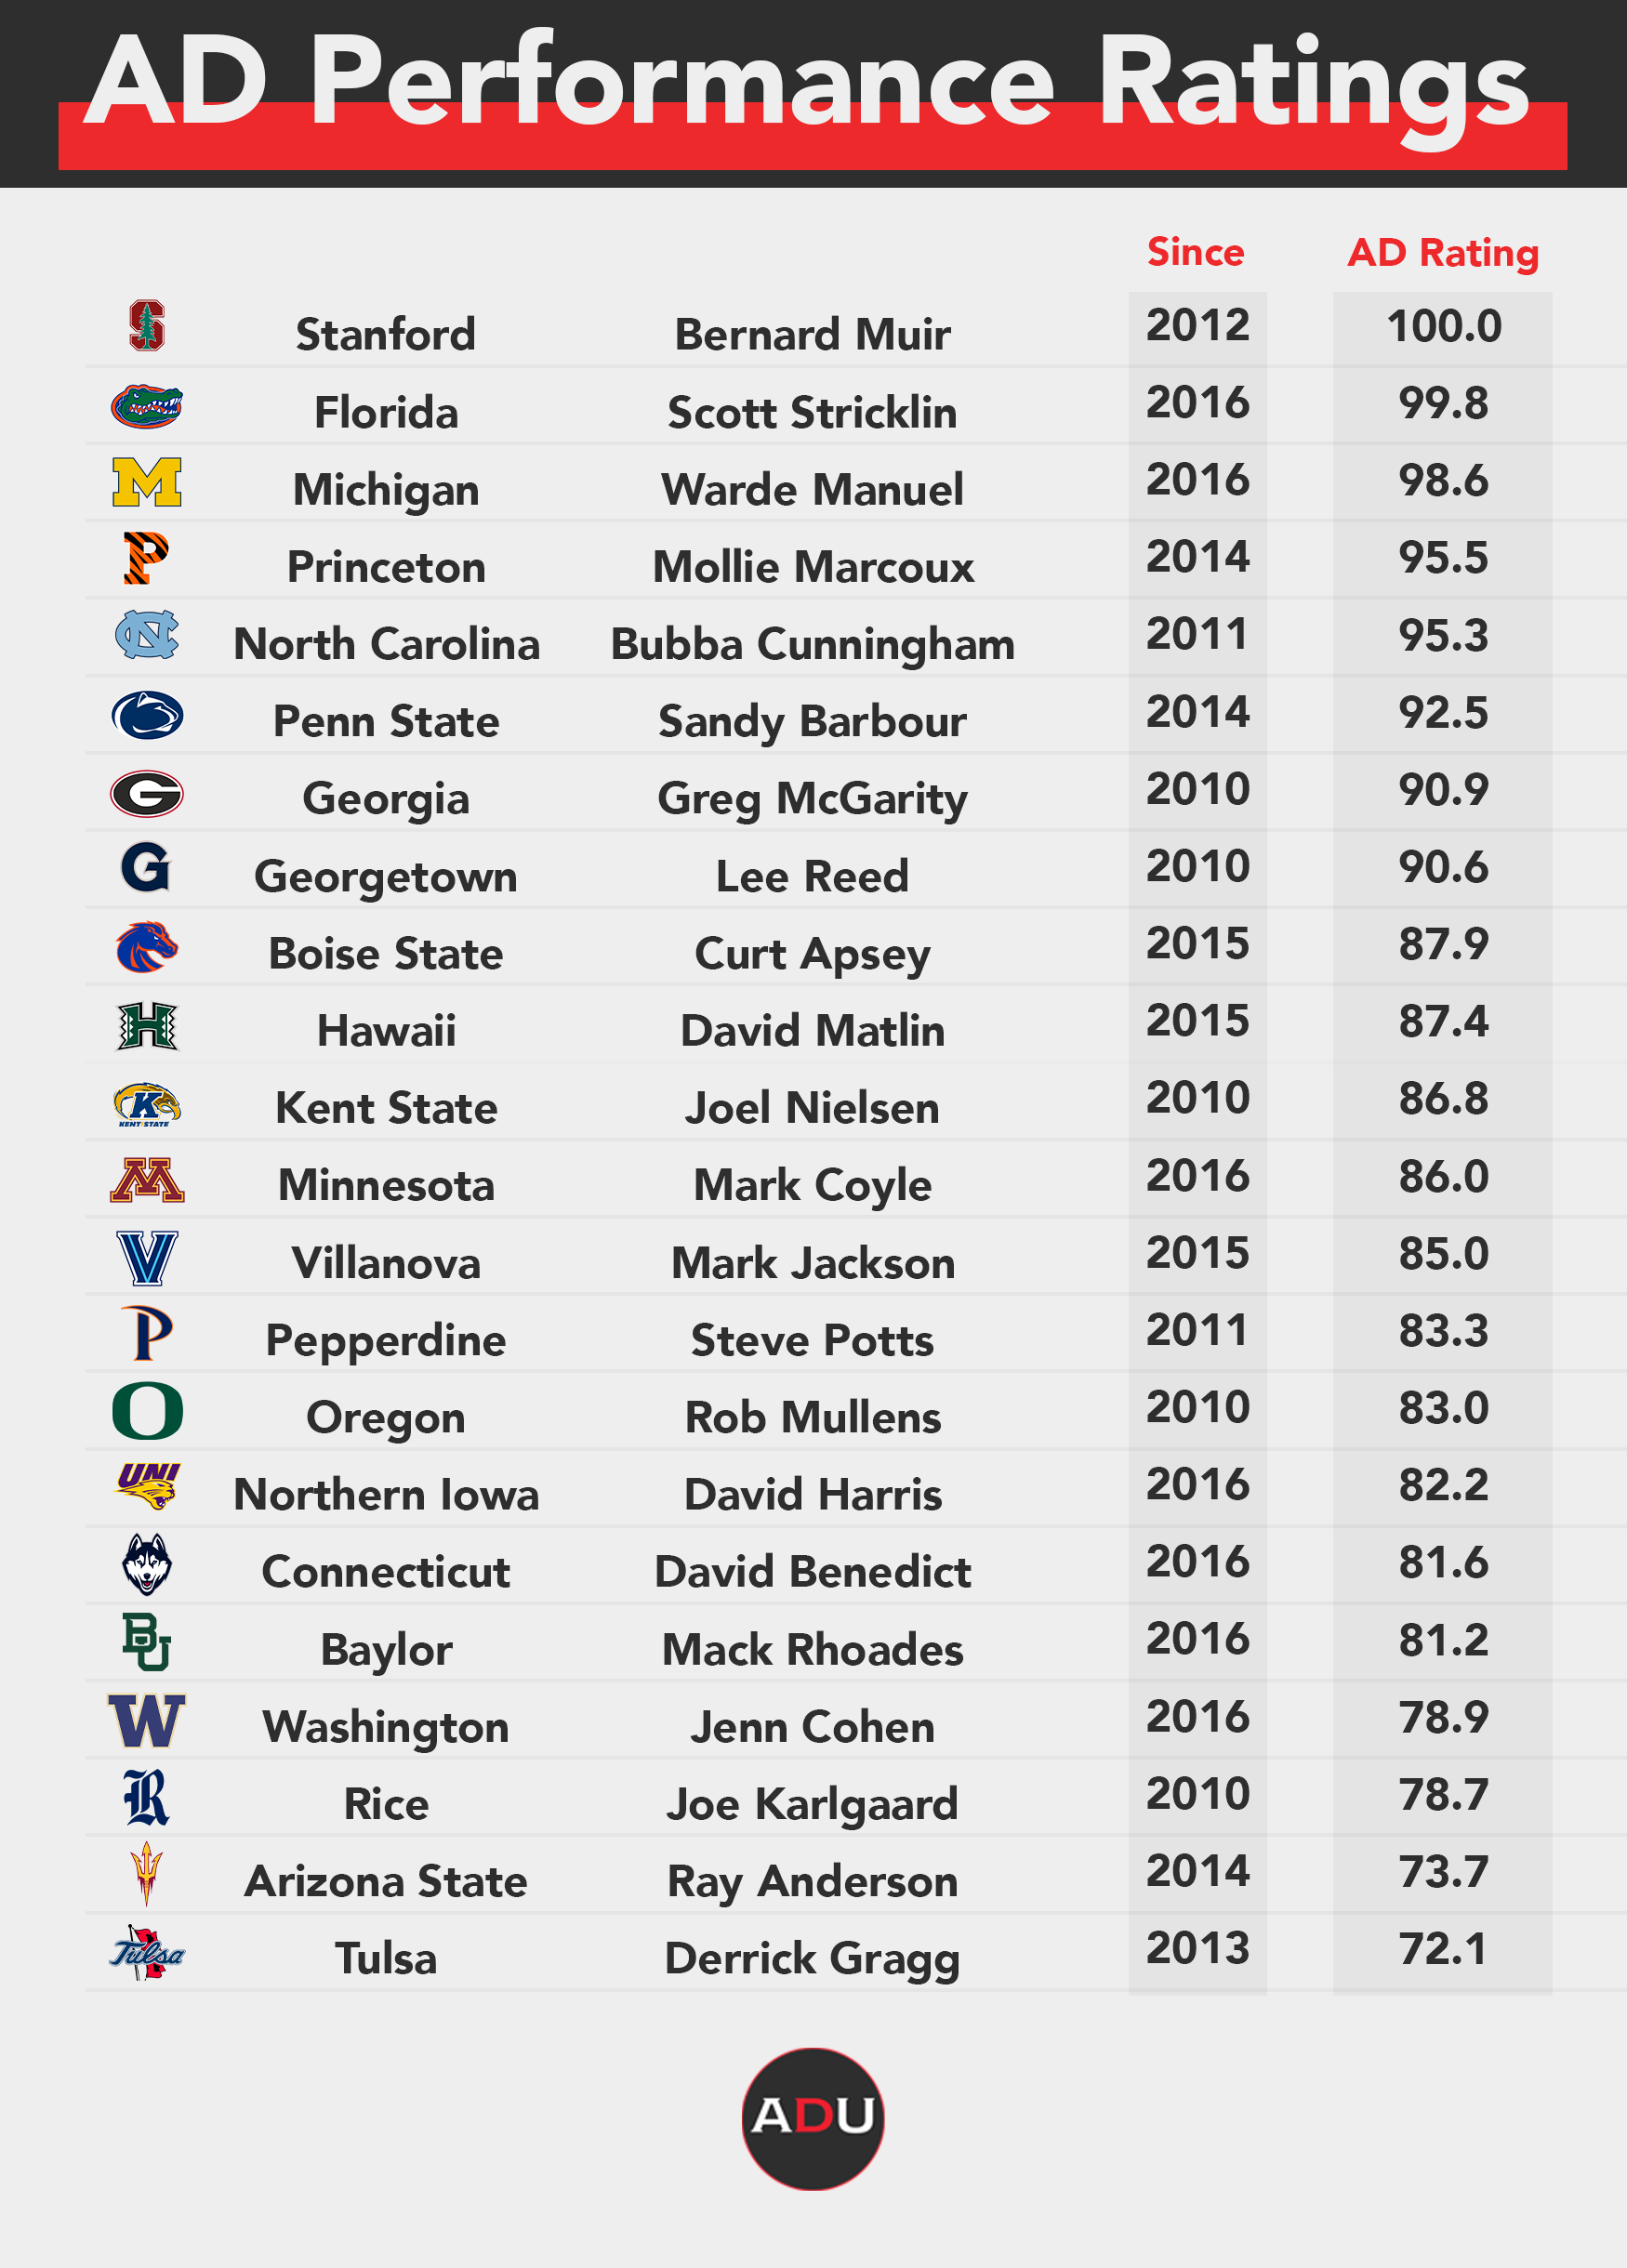
In an effort to identify the strongest athletic director hires of the past decade, the table below displays each of the 22 institutions that have recorded an average rating of at least 70.0 over the span of the athletic director’s tenure.

Stanford’s Bernard Muir leads the way with a perfect score of 100.0 as Stanford has captured every Directors’ Cup title since its inception in 1993. Florida’s Scott Stricklin and Michigan’s Warde Manuel round out the top three with scores of 99.8 and 98.6, respectively.
Several non-power conferences are represented among the top 22 athletic director ratings, including Ivy League’s Princeton, Mountain West’s Boise State, Big West’s Hawaii, MAC’s Kent State and WCC’s Pepperdine, among others. These institutions have consistently finished towards or at the top of their respective conference’s standings while also ranking high nationally in the Directors’ Cup standings.
Among the 19 institutions with an average rating of 90.0 or higher since 2010, only five have had the same athletic director throughout the period. These athletic directors include Ohio State’s Gene Smith, BYU’s Tom Holmoe, UCLA’s Dan Guerrero, Oklahoma’s Joe Castiglione and Duke’s Kevin White.
Because the institutions listed above have historically performed well in the Directors’ Cup, it is challenging to identify a significant change in institutional results under specific athletic directors.
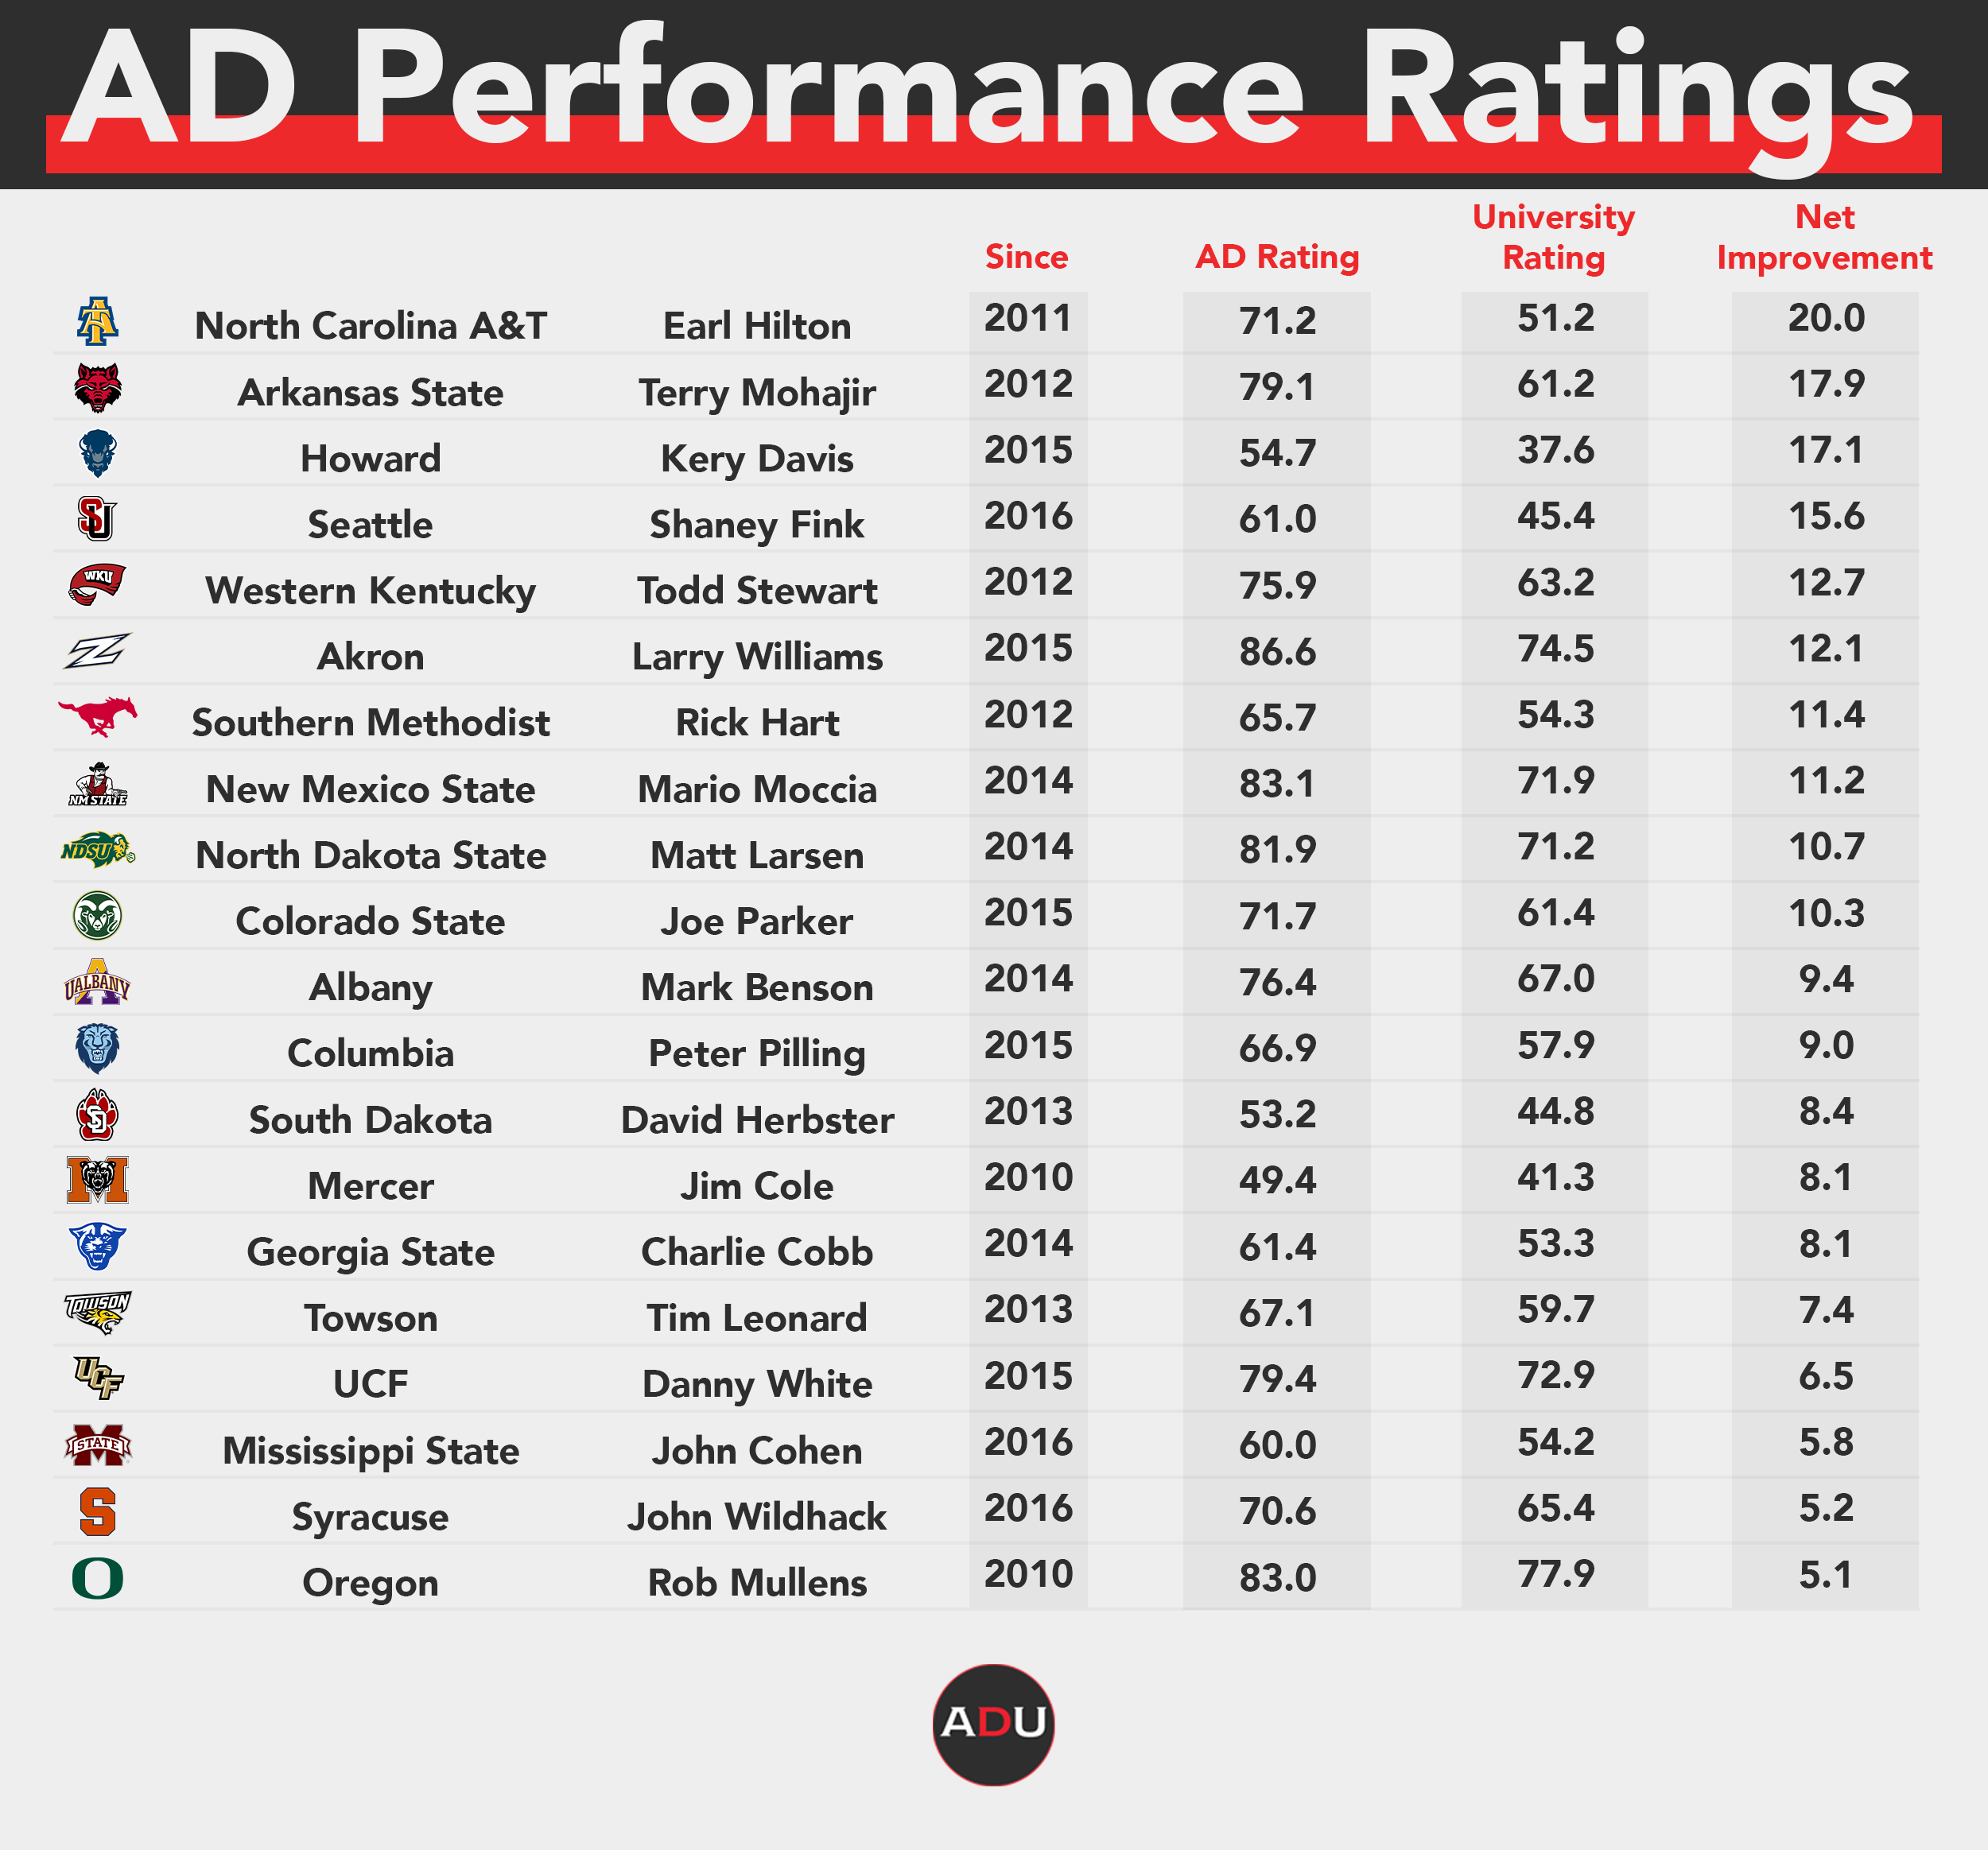
The table below, however, lists out each of the institutions that have performed at least 5.0 points higher than their 15-year institutional average under an athletic director hired since 2010.

This data set acts as an identifier of the strongest positive influences that new athletic directors have had on their institution’s athletic successes.
North Carolina A&T’s Earl Hilton has helped lead four consecutive first-place finishes in the MEAC standings while the institution has improved in overall Directors’ Cup rank every year since 2014. North Carolina A&T ranked 291st in national Directors’ Cup rankings in 2014 and has dramatically jumped into the top 100, landing at 85th in 2019. Throughout the past 15 years, NCA&T’s average university rating is 51.2 but is 20 points higher at 71.2 under Hilton’s lead.
Arkansas State’s Terry Mohajir (plus-17.9), Howard’s Kery Davis (plus-17.1) and Seattle’s Shaney Fink (plus-15.6) have also led significant institutional improvements since landing in their athletic director roles.
This list isn’t exclusive to non-power conference institutions, though. Mississippi State’s John Cohen, Syracuse’s John Wildhack and Oregon’s Rob Mullens are among the 20 athletic directors who have helped create the highest positive change in athletic performance in comparison to their respective institutional averages.
Athletic Director Turnover
Since 2010, 102 of the 292 examined schools have made at least two athletic director changes. A total of 127 schools have made one athletic director change and 63 schools have retained the same athletic director throughout that period.
Of the 20 highest-rated schools, six haven’t made an athletic director change since 2010, 11 have made either one or two changes, and three schools — Texas, Texas A&M and USC — have made three changes. Even despite the turnover, though, each of the three institutions are performing either at roughly the same level or slightly higher than their 15-year institutional average.
Additionally, the top 100 schools averaged 1.19 athletic director changes since 2010 while the 192 sub-100 schools average a near-identical 1.20 athletic director changes. Power-5 schools, meanwhile, averaged 1.31 athletic director changes since 2010 while the remaining schools averaged 1.17 athletic director changes over the same period. According to the data, there isn’t a correlation between athletic director turnover and average institutional rating.
Conclusion
Unlike coaching carousels in sports such as football and basketball, causes and effects in institutional athletic performance under certain athletic directors aren’t nearly as identifiable. Some athletic directors who have helped lead high Directors’ Cup finishes have come from power conferences like Florida’s Scott Stricklin (Mississippi State). Others, however, are products of non-power conference institutions like Stanford’s Bernard Muir (Delaware) or even outside of Division-I competition like Princeton’s Mollie Marcoux, who previously served as an executive with Chelsea Piers Management.
Not only are these athletic directors coming from different backgrounds, but several successful institutions are products of varying conferences and university sizes as well. Of the 22 institutions with the highest-rated active athletic directors hired since 2010, 14 of them are from different conferences. While power conference giants like Stanford and Florida consistently dominate the Directors’ Cup standings, several non-power conference institutions like Denver, Northern Iowa and New Mexico State continue to make their mark on the national scale while finishing atop their conference leaderboards.
As previous data has identified, national athletic success isn’t particular to a certain institution, conference or athletic director. For that reason, institutional leaders should feel empowered in knowing that, under the correct guidance, any institution is capable of thriving.


