
During the 2019 fiscal year, Georgia became the first school to surpass the $3 million mark in college football recruiting expenses, blowing past it after investing $3,676,858 into football recruiting last fiscal year – more than $1 million more than its nation-leading $2.62M spent in 2018.
Thirty-eight of the 52 public Power Five schools spent more on college football recruiting than they did in 2018. On average, public Power Five schools spent $103,478 more on recruiting, per school, than they did during the previous recruiting cycle, continuing an upwards trend in the investment on the recruiting trail across the sport.
Financial data was obtained via NCAA Financial Reports acquired by AthleticDirectorU via public records requests. Data is unavailable for 11 private institutions in the Power Five. Pitt isn’t required to comply with public records requests as a state-related institution.
Virginia Tech hasn’t published its 2019 NCAA Financial Report yet, so it wasn’t included in this study. For reference, Virginia Tech spent $563,744 on recruiting during the 2018 fiscal year, which ranked 42nd among public Power Five schools.
Recruiting expenses, as defined by the NCAA Financial Report forms that schools fill out annually, “input transportation, lodging and meals for prospective student-athletes and institutional personnel on official and unofficial visits, telephone call charges, postage and such. Include value of use of institution’s own vehicles or airplanes as well as in-kind value of loaned or contributed transportation.”
It’s worth noting that while schools track the same types of expenses under the category of recruiting, the way they do their accounting could vary from school to school. That starts with the nation’s leading spender in recruiting – Georgia.
“I think those numbers are skewed a bit because we don’t have our own airplane or our jet,” Georgia Athletic Director Greg McGarity said, according to the Athens Banner-Herald. “Some schools calculate it differently. If we had a jet, we’d certainly cover other expenses in a different category. Right now when we lease an aircraft we just pay the going rate. We just pay straight out for any charter services it would use as opposed to having an aircraft which some schools do… Cost may be hidden in another category as far as how it’s accounted for. Having gone through that at Florida, which had two aircraft at the time, I know how the expenses are accounted for with aircraft. It’s a little bit different. It’s never really apples and apples, but it kind of is what it is to be able to recruit nationally.”
Here are the complete rankings of public Power Five schools based on their spending on recruiting during the 2019 fiscal year (last year’s spending ranking among public Power Five schools in parentheses):
![]()
The SEC has used the tagline, “It just means more,” and that’s true – at least in terms of how much the conference’s member schools spend on football recruiting. The top three spenders last year play in the SEC, as do four of the top five and five of the top seven.
Here’s the breakdown by conference.
Here are the Power Five conferences, based on the average spending on football recruiting by each conference’s public schools in 2019:
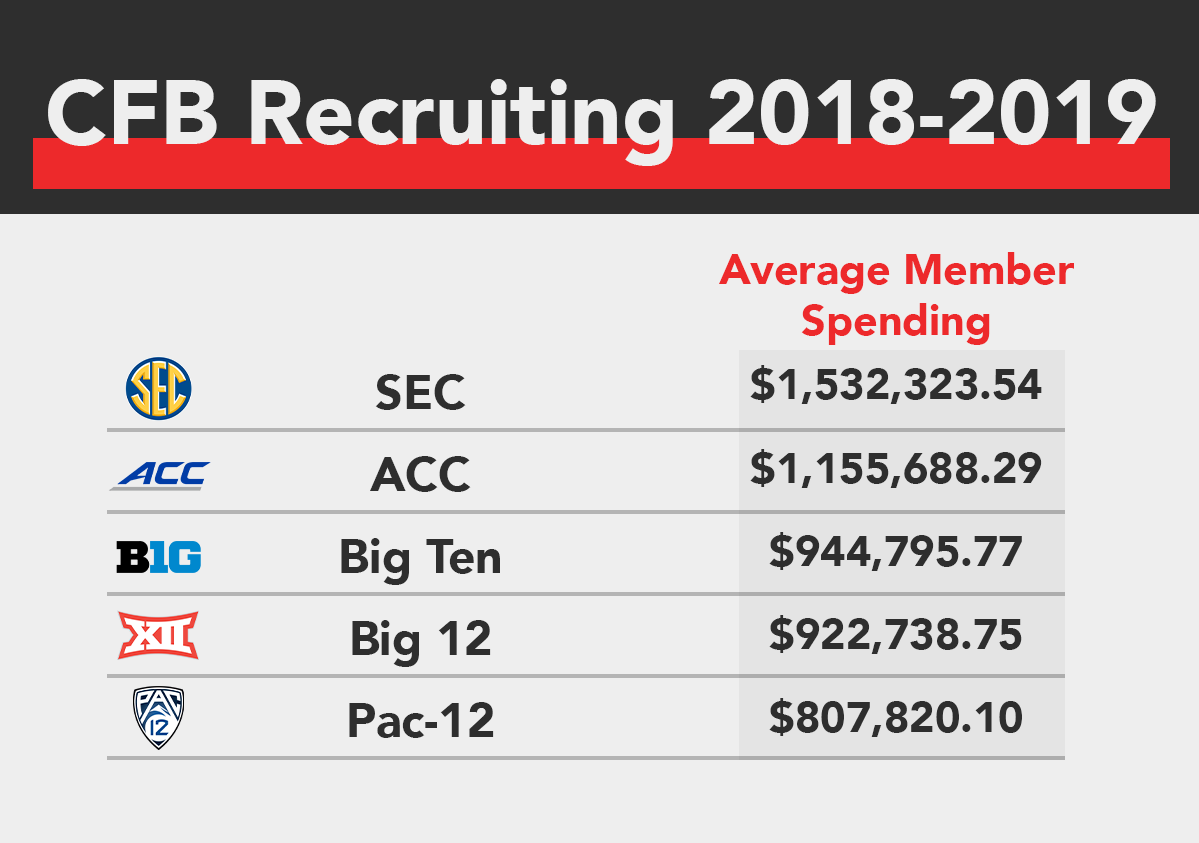
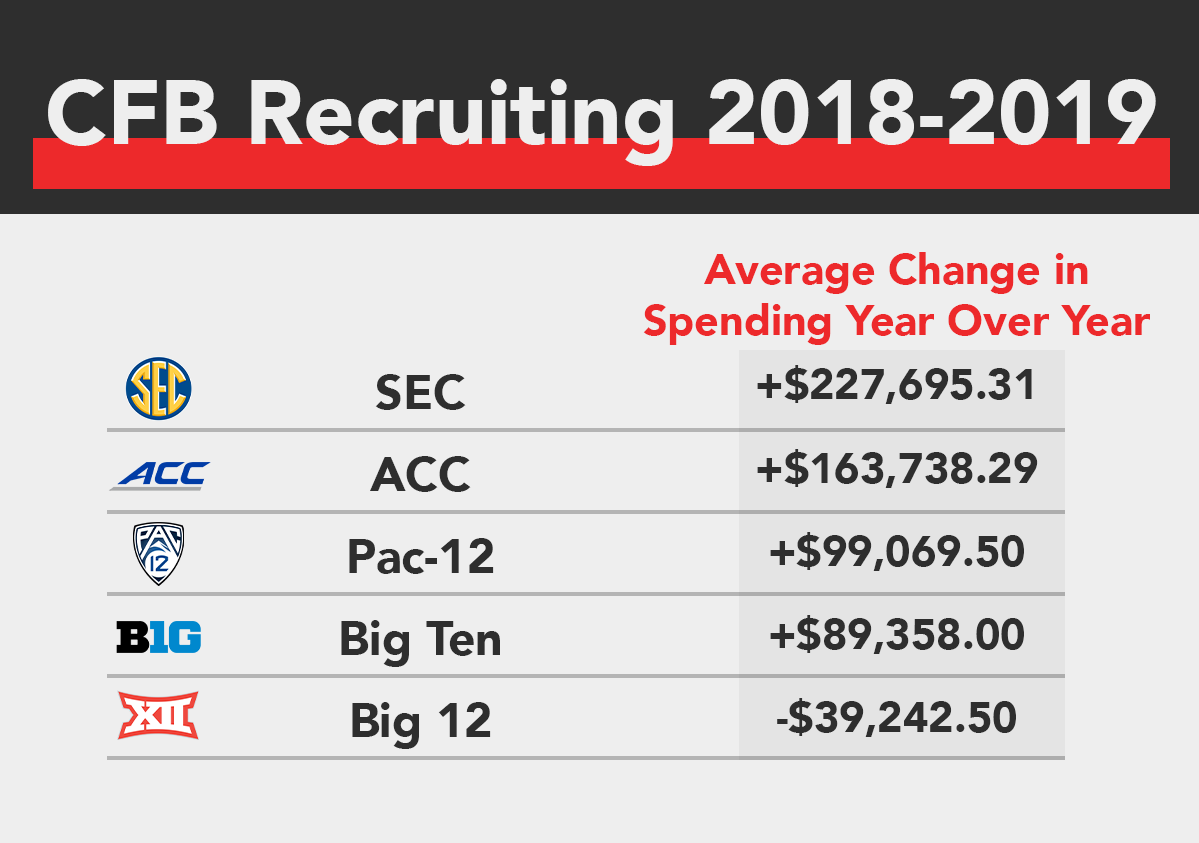
Not only did the SEC spend the most on recruiting on average per public school, it also had the biggest year-over-year increase in spending based on both percentage increase. So not only is the SEC spending more money on recruiting than any other conference but its schools are also increasing their recruiting budgets by more money annually than any other conference.
The following schools saw the biggest increases in gross spending on recruiting from the 2018 fiscal year to 2019:
![]()
The following schools saw the biggest year-over-year increases in spending, based on percentage:
![]()
From the two lists above – increases in spending in terms of gross dollars spent and percentage increase – you’ll notice that there are two primary categories of schools: 1) playoff contenders and 2) schools with first-year head coaches.
Clemson (No. 3 in terms of spending increase in gross dollars) and LSU (No. 4) met in last season’s College Football Playoff National Championship, while Georgia (No. 1) and Alabama (No. 7) were both ranked in the top three of the preseason AP poll with the Crimson Tide at preseason No. 2 and the Bulldogs at No. 3.
Then there’s a group of schools that had a new head coach during the 2019 season: Georgia Tech (Geoff Collins), Kansas State (Chris Klieman), Louisville (Scott Satterfield) and Texas Tech (Matt Wells). These schools aren’t ranked among the national leaders in the financial investment into recruiting, let alone in their conference in some cases, but their first-year head coaches increased their respective school’s investment so that they’re closer to the national average.
With the exception of Louisville, the other three schools were ranked outside of the top 40 spenders in recruiting spending in 2018 in the Power Five. With a new coach in 2019, each school improved its Power Five public school recruiting spending ranking by at least 10 spots, led by Kansas State’s just from No. 50 to No. 32.
The following scatter plot shows the relationship between 2019 recruiting spending and 2019 recruiting class ranking, according to the 247Sports Composite rankings.
Athletic Director U obtained as many NCAA Financial Reports as possible from 2005 through 2019. In 2005, the 37 current Power Five schools for which ADU obtained an NCAA Financial Report spent a combined $11,404,668 on recruiting – an average of roughly $308,000 per school.
Last fiscal year, the SEC’s 13 public schools spent a combined $19,920,206 on recruiting and the Big Ten’s 13 public schools spent $12,282,345.
Here’s a look at the top 10 Power Five spenders in recruiting, annually, over the last 15 years.
Note: Data doesn’t include Alabama: 2005-07, Arkansas 2005-08, Arizona 2005-06, Auburn 2005-08, Georgia Tech 2005-17, Indiana 2007, Iowa St. 2005-16, Michigan State 2006-07, Mississippi State 2005-17, NC State 2006, Oklahoma State 2005-07, 2009, 2011, Oregon 2005-07, Oregon State 2007, Penn State 2005-10, Tennessee 2005-12, Texas 2005-08, Virginia Tech 2019, Washington 2005-17, Washington State 2005-12, West Virginia 2005-17